Data
83,911 items of data are available, covering 79,384 participants.
Defined-instances run from 2 to 3, labelled using Instancing
2.
Units of measurement are AU.
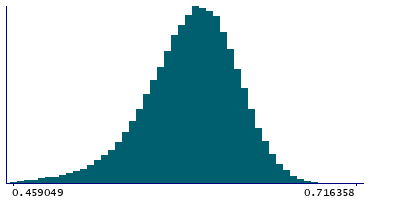
| Maximum | 0.716358 |
| Decile 9 | 0.632408 |
| Decile 8 | 0.619753 |
| Decile 7 | 0.61018 |
| Decile 6 | 0.601455 |
| Median | 0.593129 |
| Decile 4 | 0.58433 |
| Decile 3 | 0.57448 |
| Decile 2 | 0.562048 |
| Decile 1 | 0.542965 |
| Minimum | 0 |
|

|
- Mean = 0.58959
- Std.dev = 0.0366947
- 242 items below graph minimum of 0.453521
|
2 Instances
Instance 2 : Imaging visit (2014+)
79,153 participants, 79,153 items
| Maximum | 0.716358 |
| Decile 9 | 0.632291 |
| Decile 8 | 0.61958 |
| Decile 7 | 0.609973 |
| Decile 6 | 0.601247 |
| Median | 0.592898 |
| Decile 4 | 0.584024 |
| Decile 3 | 0.574132 |
| Decile 2 | 0.561605 |
| Decile 1 | 0.542534 |
| Minimum | 0 |
|
|
- Mean = 0.589292
- Std.dev = 0.0368447
- 230 items below graph minimum of 0.452776
|
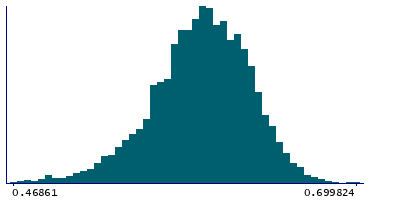
Instance 3 : First repeat imaging visit (2019+)
4,758 participants, 4,758 items
| Maximum | 0.699824 |
| Decile 9 | 0.63406 |
| Decile 8 | 0.622752 |
| Decile 7 | 0.613358 |
| Decile 6 | 0.604863 |
| Median | 0.597096 |
| Decile 4 | 0.589045 |
| Decile 3 | 0.580049 |
| Decile 2 | 0.568908 |
| Decile 1 | 0.551295 |
| Minimum | 0.425422 |
|
|
- Mean = 0.59455
- Std.dev = 0.0337172
- 11 items below graph minimum of 0.46853
|
Notes
Mean FA (fractional anisotropy) in posterior thalamic radiation (right) on FA skeleton (from dMRI data)
0 Related Data-Fields
There are no related data-fields
2 Applications
| Application ID | Title |
|---|
| 17689 | Genetic, environmental and lifestyle predictors of brain/cognitive-related outcomes. |
| 22783 | The joint analysis of imaging data and genetic data for early tumor detection, prevention, diagnosis and treatment |

