Data
83,911 items of data are available, covering 79,384 participants.
Defined-instances run from 2 to 3, labelled using Instancing
2.
Units of measurement are AU.
| Maximum | 0.669888 |
| Decile 9 | 0.503181 |
| Decile 8 | 0.487995 |
| Decile 7 | 0.47705 |
| Decile 6 | 0.467661 |
| Median | 0.458834 |
| Decile 4 | 0.450079 |
| Decile 3 | 0.440476 |
| Decile 2 | 0.429148 |
| Decile 1 | 0.412915 |
| Minimum | 0 |
|
|
- Mean = 0.458236
- Std.dev = 0.0358739
- 82 items below graph minimum of 0.322649
- 8 items above graph maximum of 0.593448
|
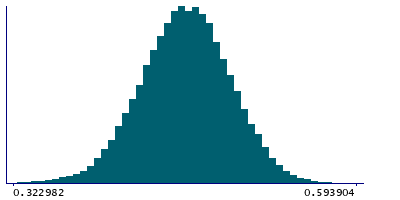
2 Instances
Instance 2 : Imaging visit (2014+)
79,153 participants, 79,153 items
| Maximum | 0.669888 |
| Decile 9 | 0.503154 |
| Decile 8 | 0.487982 |
| Decile 7 | 0.477012 |
| Decile 6 | 0.467585 |
| Median | 0.458779 |
| Decile 4 | 0.449968 |
| Decile 3 | 0.44039 |
| Decile 2 | 0.429072 |
| Decile 1 | 0.412791 |
| Minimum | 0 |
|

|
- Mean = 0.458163
- Std.dev = 0.0359335
- 79 items below graph minimum of 0.322429
- 8 items above graph maximum of 0.593516
|
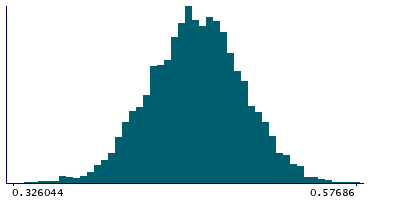
Instance 3 : First repeat imaging visit (2019+)
4,758 participants, 4,758 items
| Maximum | 0.57686 |
| Decile 9 | 0.503659 |
| Decile 8 | 0.488285 |
| Decile 7 | 0.47788 |
| Decile 6 | 0.468884 |
| Median | 0.459765 |
| Decile 4 | 0.451606 |
| Decile 3 | 0.442499 |
| Decile 2 | 0.430541 |
| Decile 1 | 0.414843 |
| Minimum | 0.174281 |
|
|
- Mean = 0.459447
- Std.dev = 0.0348456
- 3 items below graph minimum of 0.326027
|
Notes
Mean FA (fractional anisotropy) in cingulum hippocampus (right) on FA skeleton (from dMRI data)
0 Related Data-Fields
There are no related data-fields
2 Applications
| Application ID | Title |
|---|
| 17689 | Genetic, environmental and lifestyle predictors of brain/cognitive-related outcomes. |
| 22783 | The joint analysis of imaging data and genetic data for early tumor detection, prevention, diagnosis and treatment |

