Data
83,911 items of data are available, covering 79,384 participants.
Defined-instances run from 2 to 3, labelled using Instancing
2.
Units of measurement are AU.
| Maximum | 0.603059 |
| Decile 9 | 0.506401 |
| Decile 8 | 0.491712 |
| Decile 7 | 0.481075 |
| Decile 6 | 0.472015 |
| Median | 0.463351 |
| Decile 4 | 0.454585 |
| Decile 3 | 0.445165 |
| Decile 2 | 0.434001 |
| Decile 1 | 0.417674 |
| Minimum | 0 |
|

|
- Mean = 0.462311
- Std.dev = 0.0356147
- 117 items below graph minimum of 0.328947
- 2 items above graph maximum of 0.595127
|
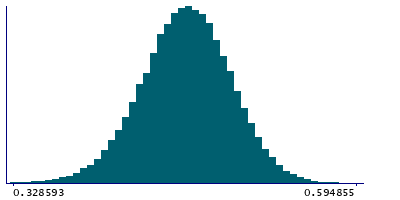
2 Instances
Instance 2 : Imaging visit (2014+)
79,153 participants, 79,153 items
| Maximum | 0.603059 |
| Decile 9 | 0.506422 |
| Decile 8 | 0.491694 |
| Decile 7 | 0.48104 |
| Decile 6 | 0.471959 |
| Median | 0.463284 |
| Decile 4 | 0.454515 |
| Decile 3 | 0.445068 |
| Decile 2 | 0.433889 |
| Decile 1 | 0.417534 |
| Minimum | 0 |
|
|
- Mean = 0.462247
- Std.dev = 0.0356786
- 109 items below graph minimum of 0.328646
- 2 items above graph maximum of 0.595311
|
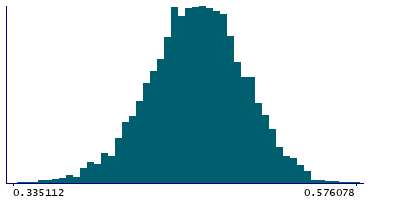
Instance 3 : First repeat imaging visit (2019+)
4,758 participants, 4,758 items
| Maximum | 0.576078 |
| Decile 9 | 0.5059 |
| Decile 8 | 0.491862 |
| Decile 7 | 0.481726 |
| Decile 6 | 0.473003 |
| Median | 0.464506 |
| Decile 4 | 0.455911 |
| Decile 3 | 0.446905 |
| Decile 2 | 0.436048 |
| Decile 1 | 0.420498 |
| Minimum | 0.151262 |
|
|
- Mean = 0.463383
- Std.dev = 0.0345162
- 8 items below graph minimum of 0.335096
|
Notes
Mean FA (fractional anisotropy) in cingulum hippocampus (left) on FA skeleton (from dMRI data)
0 Related Data-Fields
There are no related data-fields
2 Applications
| Application ID | Title |
|---|
| 17689 | Genetic, environmental and lifestyle predictors of brain/cognitive-related outcomes. |
| 22783 | The joint analysis of imaging data and genetic data for early tumor detection, prevention, diagnosis and treatment |

