Data
83,911 items of data are available, covering 79,384 participants.
Defined-instances run from 2 to 3, labelled using Instancing
2.
Units of measurement are AU.
| Maximum | 0.738617 |
| Decile 9 | 0.512496 |
| Decile 8 | 0.493583 |
| Decile 7 | 0.479873 |
| Decile 6 | 0.468257 |
| Median | 0.457338 |
| Decile 4 | 0.446572 |
| Decile 3 | 0.434608 |
| Decile 2 | 0.420239 |
| Decile 1 | 0.398234 |
| Minimum | 0.054242 |
|
|
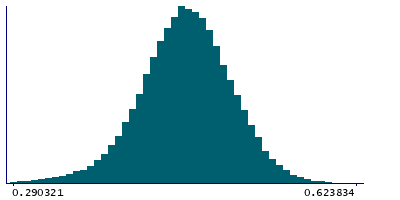
- Mean = 0.455659
- Std.dev = 0.0465282
- 194 items below graph minimum of 0.283971
- 6 items above graph maximum of 0.626759
|
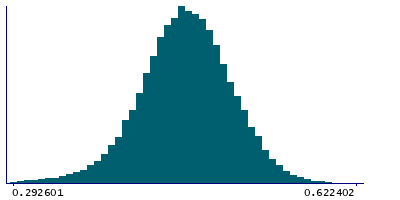
2 Instances
Instance 2 : Imaging visit (2014+)
79,153 participants, 79,153 items
| Maximum | 0.738617 |
| Decile 9 | 0.512489 |
| Decile 8 | 0.493475 |
| Decile 7 | 0.479787 |
| Decile 6 | 0.468136 |
| Median | 0.457149 |
| Decile 4 | 0.446347 |
| Decile 3 | 0.434386 |
| Decile 2 | 0.41993 |
| Decile 1 | 0.397923 |
| Minimum | 0.054242 |
|
|
- Mean = 0.455469
- Std.dev = 0.0466662
- 179 items below graph minimum of 0.283358
- 5 items above graph maximum of 0.627054
|
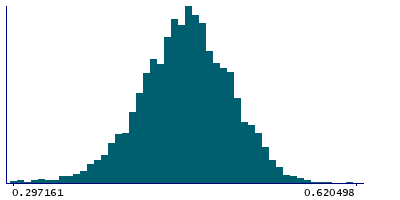
Instance 3 : First repeat imaging visit (2019+)
4,758 participants, 4,758 items
| Maximum | 0.738246 |
| Decile 9 | 0.512773 |
| Decile 8 | 0.495641 |
| Decile 7 | 0.481202 |
| Decile 6 | 0.470232 |
| Median | 0.460608 |
| Decile 4 | 0.450001 |
| Decile 3 | 0.439086 |
| Decile 2 | 0.42455 |
| Decile 1 | 0.405011 |
| Minimum | 0.208532 |
|
|
- Mean = 0.458815
- Std.dev = 0.0440498
- 14 items below graph minimum of 0.297249
- 1 item above graph maximum of 0.620534
|
Notes
Mean FA (fractional anisotropy) in superior fronto-occipital fasciculus (right) on FA skeleton (from dMRI data)
0 Related Data-Fields
There are no related data-fields
2 Applications
| Application ID | Title |
|---|
| 17689 | Genetic, environmental and lifestyle predictors of brain/cognitive-related outcomes. |
| 22783 | The joint analysis of imaging data and genetic data for early tumor detection, prevention, diagnosis and treatment |

