Data
83,911 items of data are available, covering 79,384 participants.
Defined-instances run from 2 to 3, labelled using Instancing
2.
Units of measurement are AU.
| Maximum | 0.834571 |
| Decile 9 | 0.516494 |
| Decile 8 | 0.498003 |
| Decile 7 | 0.484534 |
| Decile 6 | 0.472761 |
| Median | 0.461639 |
| Decile 4 | 0.450253 |
| Decile 3 | 0.437354 |
| Decile 2 | 0.421458 |
| Decile 1 | 0.396062 |
| Minimum | 0.042164 |
|

|
- Mean = 0.458077
- Std.dev = 0.0491198
- 200 items below graph minimum of 0.275629
- 7 items above graph maximum of 0.636926
|
2 Instances
Instance 2 : Imaging visit (2014+)
79,153 participants, 79,153 items
| Maximum | 0.756805 |
| Decile 9 | 0.516351 |
| Decile 8 | 0.497839 |
| Decile 7 | 0.484336 |
| Decile 6 | 0.472592 |
| Median | 0.461438 |
| Decile 4 | 0.449994 |
| Decile 3 | 0.437059 |
| Decile 2 | 0.421138 |
| Decile 1 | 0.395503 |
| Minimum | 0.042164 |
|

|
- Mean = 0.457813
- Std.dev = 0.0491992
- 180 items below graph minimum of 0.274655
- 6 items above graph maximum of 0.637199
|
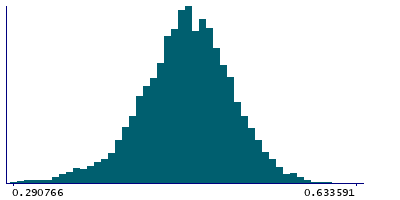
Instance 3 : First repeat imaging visit (2019+)
4,758 participants, 4,758 items
| Maximum | 0.834571 |
| Decile 9 | 0.519344 |
| Decile 8 | 0.500677 |
| Decile 7 | 0.486872 |
| Decile 6 | 0.476146 |
| Median | 0.464589 |
| Decile 4 | 0.454322 |
| Decile 3 | 0.44275 |
| Decile 2 | 0.426751 |
| Decile 1 | 0.404996 |
| Minimum | 0.186021 |
|
|
- Mean = 0.462461
- Std.dev = 0.0475663
- 18 items below graph minimum of 0.290648
- 1 item above graph maximum of 0.633693
|
Notes
Mean FA (fractional anisotropy) in superior fronto-occipital fasciculus (left) on FA skeleton (from dMRI data)
0 Related Data-Fields
There are no related data-fields
2 Applications
| Application ID | Title |
|---|
| 17689 | Genetic, environmental and lifestyle predictors of brain/cognitive-related outcomes. |
| 22783 | The joint analysis of imaging data and genetic data for early tumor detection, prevention, diagnosis and treatment |

