Data
83,911 items of data are available, covering 79,384 participants.
Defined-instances run from 2 to 3, labelled using Instancing
2.
Units of measurement are AU.
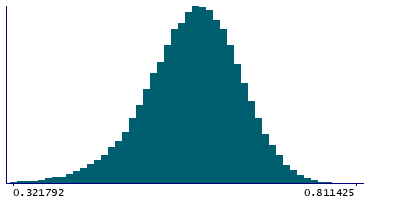
| Maximum | 0.811425 |
| Decile 9 | 0.658389 |
| Decile 8 | 0.631995 |
| Decile 7 | 0.612615 |
| Decile 6 | 0.595471 |
| Median | 0.579004 |
| Decile 4 | 0.561998 |
| Decile 3 | 0.543366 |
| Decile 2 | 0.520067 |
| Decile 1 | 0.48566 |
| Minimum | 0 |
|
|
- Mean = 0.574423
- Std.dev = 0.0692745
- 123 items below graph minimum of 0.312931
|
2 Instances
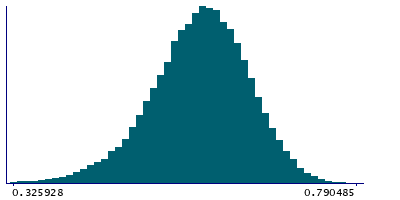
Instance 2 : Imaging visit (2014+)
79,153 participants, 79,153 items
| Maximum | 0.811425 |
| Decile 9 | 0.658357 |
| Decile 8 | 0.631809 |
| Decile 7 | 0.612333 |
| Decile 6 | 0.595179 |
| Median | 0.578742 |
| Decile 4 | 0.56171 |
| Decile 3 | 0.54313 |
| Decile 2 | 0.519737 |
| Decile 1 | 0.485194 |
| Minimum | 0 |
|
|
- Mean = 0.574152
- Std.dev = 0.0694131
- 119 items below graph minimum of 0.312031
|
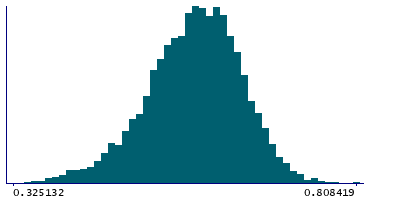
Instance 3 : First repeat imaging visit (2019+)
4,758 participants, 4,758 items
| Maximum | 0.808419 |
| Decile 9 | 0.658948 |
| Decile 8 | 0.634892 |
| Decile 7 | 0.616318 |
| Decile 6 | 0.599843 |
| Median | 0.583559 |
| Decile 4 | 0.567089 |
| Decile 3 | 0.547735 |
| Decile 2 | 0.525656 |
| Decile 1 | 0.491993 |
| Minimum | 0.297446 |
|
|
- Mean = 0.578934
- Std.dev = 0.0667651
- 6 items below graph minimum of 0.325039
|
Notes
Mean FA (fractional anisotropy) in tapetum (left) on FA skeleton (from dMRI data)
0 Related Data-Fields
There are no related data-fields
2 Applications
| Application ID | Title |
|---|
| 17689 | Genetic, environmental and lifestyle predictors of brain/cognitive-related outcomes. |
| 22783 | The joint analysis of imaging data and genetic data for early tumor detection, prevention, diagnosis and treatment |

