Data
83,911 items of data are available, covering 79,384 participants.
Defined-instances run from 2 to 3, labelled using Instancing
2.
Units of measurement are AU.
| Maximum | 0.002274 |
| Decile 9 | 0.000769 |
| Decile 8 | 0.000754 |
| Decile 7 | 0.000744 |
| Decile 6 | 0.000737 |
| Median | 0.000731 |
| Decile 4 | 0.000725 |
| Decile 3 | 0.000719 |
| Decile 2 | 0.000713 |
| Decile 1 | 0.000703 |
| Minimum | 0 |
|

|
- Mean = 0.000735582
- Std.dev = 3.42e-05
- 17 items below graph minimum of 0.000637
- 1147 items above graph maximum of 0.000835
|
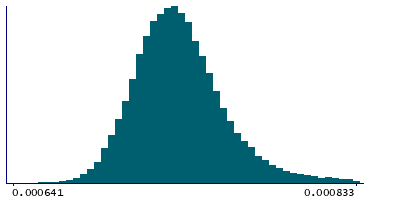
2 Instances
Instance 2 : Imaging visit (2014+)
79,153 participants, 79,153 items
| Maximum | 0.002274 |
| Decile 9 | 0.00077 |
| Decile 8 | 0.000754 |
| Decile 7 | 0.000745 |
| Decile 6 | 0.000738 |
| Median | 0.000732 |
| Decile 4 | 0.000726 |
| Decile 3 | 0.00072 |
| Decile 2 | 0.000713 |
| Decile 1 | 0.000704 |
| Minimum | 0 |
|
|
- Mean = 0.00073599
- Std.dev = 3.43471e-05
- 18 items below graph minimum of 0.000638
- 1098 items above graph maximum of 0.000836
|
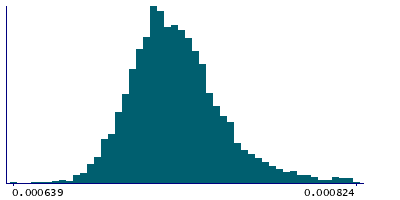
Instance 3 : First repeat imaging visit (2019+)
4,758 participants, 4,758 items
| Maximum | 0.001107 |
| Decile 9 | 0.000761 |
| Decile 8 | 0.000746 |
| Decile 7 | 0.000737 |
| Decile 6 | 0.000731 |
| Median | 0.000725 |
| Decile 4 | 0.000719 |
| Decile 3 | 0.000713 |
| Decile 2 | 0.000707 |
| Decile 1 | 0.000698 |
| Minimum | 0.000639 |
|
|
- Mean = 0.000728804
- Std.dev = 3.08735e-05
- 68 items above graph maximum of 0.000824
|
Notes
Mean MD (mean diffusivity) in inferior cerebellar peduncle (left) on FA (fractional anisotropy) skeleton (from dMRI data)
0 Related Data-Fields
There are no related data-fields
2 Applications
| Application ID | Title |
|---|
| 17689 | Genetic, environmental and lifestyle predictors of brain/cognitive-related outcomes. |
| 22783 | The joint analysis of imaging data and genetic data for early tumor detection, prevention, diagnosis and treatment |

