Data
83,911 items of data are available, covering 79,384 participants.
Defined-instances run from 2 to 3, labelled using Instancing
2.
Units of measurement are AU.
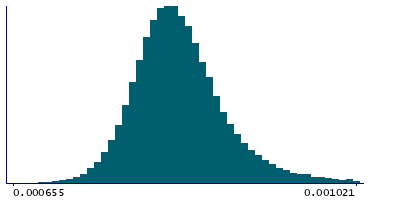
| Maximum | 0.001907 |
| Decile 9 | 0.000897 |
| Decile 8 | 0.000866 |
| Decile 7 | 0.000848 |
| Decile 6 | 0.000835 |
| Median | 0.000824 |
| Decile 4 | 0.000813 |
| Decile 3 | 0.000802 |
| Decile 2 | 0.00079 |
| Decile 1 | 0.000773 |
| Minimum | 0 |
|
|
- Mean = 0.000833066
- Std.dev = 6.43508e-05
- 6 items below graph minimum of 0.000649
- 1392 items above graph maximum of 0.001021
|
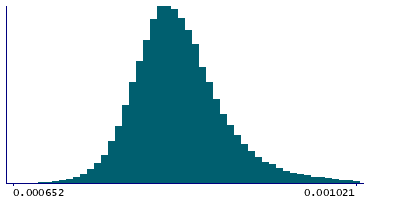
2 Instances
Instance 2 : Imaging visit (2014+)
79,153 participants, 79,153 items
| Maximum | 0.001907 |
| Decile 9 | 0.000898 |
| Decile 8 | 0.000867 |
| Decile 7 | 0.000849 |
| Decile 6 | 0.000836 |
| Median | 0.000824 |
| Decile 4 | 0.000813 |
| Decile 3 | 0.000803 |
| Decile 2 | 0.00079 |
| Decile 1 | 0.000773 |
| Minimum | 0 |
|
|
- Mean = 0.000833754
- Std.dev = 6.47749e-05
- 6 items below graph minimum of 0.000648
- 1319 items above graph maximum of 0.001023
|
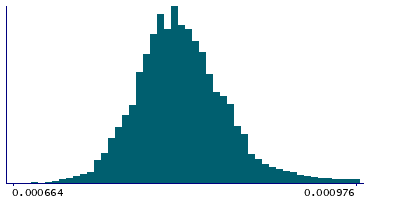
Instance 3 : First repeat imaging visit (2019+)
4,758 participants, 4,758 items
| Maximum | 0.001661 |
| Decile 9 | 0.0008725 |
| Decile 8 | 0.000851 |
| Decile 7 | 0.000836 |
| Decile 6 | 0.000825 |
| Median | 0.000814 |
| Decile 4 | 0.000806 |
| Decile 3 | 0.000795 |
| Decile 2 | 0.000784 |
| Decile 1 | 0.000768 |
| Minimum | 0.000653 |
|
|
- Mean = 0.000821626
- Std.dev = 5.55991e-05
- 1 item below graph minimum of 0.0006635
- 83 items above graph maximum of 0.000977
|
Notes
Mean MD (mean diffusivity) in fornix cres+stria terminalis (left) on FA (fractional anisotropy) skeleton (from dMRI data)
0 Related Data-Fields
There are no related data-fields
2 Applications
| Application ID | Title |
|---|
| 17689 | Genetic, environmental and lifestyle predictors of brain/cognitive-related outcomes. |
| 22783 | The joint analysis of imaging data and genetic data for early tumor detection, prevention, diagnosis and treatment |

