Data
83,911 items of data are available, covering 79,384 participants.
Defined-instances run from 2 to 3, labelled using Instancing
2.
Units of measurement are AU.
| Maximum | 0.001612 |
| Decile 9 | 0.000791 |
| Decile 8 | 0.000772 |
| Decile 7 | 0.00076 |
| Decile 6 | 0.000751 |
| Median | 0.000743 |
| Decile 4 | 0.000735 |
| Decile 3 | 0.000727 |
| Decile 2 | 0.000718 |
| Decile 1 | 0.000707 |
| Minimum | 0.000509 |
|
|
- Mean = 0.000747127
- Std.dev = 3.72968e-05
- 8 items below graph minimum of 0.000623
- 663 items above graph maximum of 0.000875
|
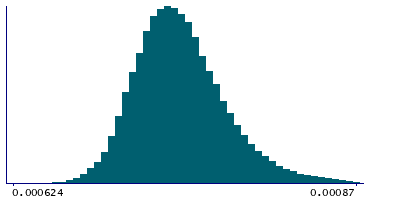
2 Instances
Instance 2 : Imaging visit (2014+)
79,153 participants, 79,153 items
| Maximum | 0.001612 |
| Decile 9 | 0.000792 |
| Decile 8 | 0.000773 |
| Decile 7 | 0.00076 |
| Decile 6 | 0.000751 |
| Median | 0.000743 |
| Decile 4 | 0.000735 |
| Decile 3 | 0.000727 |
| Decile 2 | 0.000719 |
| Decile 1 | 0.000707 |
| Minimum | 0.000509 |
|

|
- Mean = 0.000747573
- Std.dev = 3.75161e-05
- 7 items below graph minimum of 0.000622
- 616 items above graph maximum of 0.000877
|
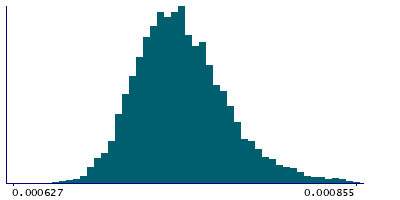
Instance 3 : First repeat imaging visit (2019+)
4,758 participants, 4,758 items
| Maximum | 0.000986 |
| Decile 9 | 0.000779 |
| Decile 8 | 0.000763 |
| Decile 7 | 0.000753 |
| Decile 6 | 0.000744 |
| Median | 0.000736 |
| Decile 4 | 0.000729 |
| Decile 3 | 0.000722 |
| Decile 2 | 0.000714 |
| Decile 1 | 0.000703 |
| Minimum | 0.000599 |
|
|
- Mean = 0.000739704
- Std.dev = 3.25533e-05
- 1 item below graph minimum of 0.000627
- 27 items above graph maximum of 0.000855
|
Notes
Mean MD (mean diffusivity) in superior longitudinal fasciculus (right) on FA (fractional anisotropy) skeleton (from dMRI data)
0 Related Data-Fields
There are no related data-fields
2 Applications
| Application ID | Title |
|---|
| 17689 | Genetic, environmental and lifestyle predictors of brain/cognitive-related outcomes. |
| 22783 | The joint analysis of imaging data and genetic data for early tumor detection, prevention, diagnosis and treatment |

