Data
83,911 items of data are available, covering 79,384 participants.
Defined-instances run from 2 to 3, labelled using Instancing
2.
Units of measurement are AU.
| Maximum | 0.001907 |
| Decile 9 | 0.000793 |
| Decile 8 | 0.000777 |
| Decile 7 | 0.000767 |
| Decile 6 | 0.000758 |
| Median | 0.00075 |
| Decile 4 | 0.000743 |
| Decile 3 | 0.000735 |
| Decile 2 | 0.000725 |
| Decile 1 | 0.000712 |
| Minimum | 0 |
|
|
- Mean = 0.000752002
- Std.dev = 3.42506e-05
- 34 items below graph minimum of 0.000631
- 255 items above graph maximum of 0.000874
|
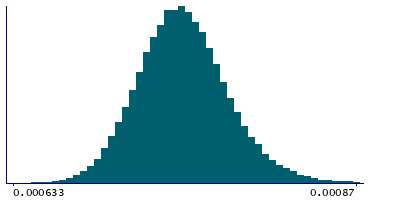
2 Instances
Instance 2 : Imaging visit (2014+)
79,153 participants, 79,153 items
| Maximum | 0.001907 |
| Decile 9 | 0.000793 |
| Decile 8 | 0.000778 |
| Decile 7 | 0.000767 |
| Decile 6 | 0.000759 |
| Median | 0.000751 |
| Decile 4 | 0.000743 |
| Decile 3 | 0.000735 |
| Decile 2 | 0.000726 |
| Decile 1 | 0.000713 |
| Minimum | 0 |
|

|
- Mean = 0.000752586
- Std.dev = 3.41956e-05
- 36 items below graph minimum of 0.000633
- 255 items above graph maximum of 0.000873
|
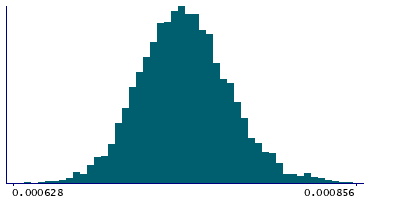
Instance 3 : First repeat imaging visit (2019+)
4,758 participants, 4,758 items
| Maximum | 0.001291 |
| Decile 9 | 0.00078 |
| Decile 8 | 0.000766 |
| Decile 7 | 0.000756 |
| Decile 6 | 0.000748 |
| Median | 0.000741 |
| Decile 4 | 0.0007335 |
| Decile 3 | 0.000726 |
| Decile 2 | 0.000717 |
| Decile 1 | 0.000704 |
| Minimum | 0.000589 |
|
|
- Mean = 0.000742278
- Std.dev = 3.3697e-05
- 3 items below graph minimum of 0.000628
- 15 items above graph maximum of 0.000856
|
Notes
Mean MD (mean diffusivity) in uncinate fasciculus (right) on FA (fractional anisotropy) skeleton (from dMRI data)
0 Related Data-Fields
There are no related data-fields
Problem running publication query
2 Applications
| Application ID | Title |
|---|
| 17689 | Genetic, environmental and lifestyle predictors of brain/cognitive-related outcomes. |
| 22783 | The joint analysis of imaging data and genetic data for early tumor detection, prevention, diagnosis and treatment |

