Data
83,911 items of data are available, covering 79,384 participants.
Defined-instances run from 2 to 3, labelled using Instancing
2.
Units of measurement are AU.
| Maximum | 0.003117 |
| Decile 9 | 0.00116 |
| Decile 8 | 0.001073 |
| Decile 7 | 0.001019 |
| Decile 6 | 0.000979 |
| Median | 0.000946 |
| Decile 4 | 0.000916 |
| Decile 3 | 0.000887 |
| Decile 2 | 0.000857 |
| Decile 1 | 0.000819 |
| Minimum | 0 |
|
|
- Mean = 0.000973004
- Std.dev = 0.000147137
- 4 items below graph minimum of 0.000478
- 546 items above graph maximum of 0.001501
|
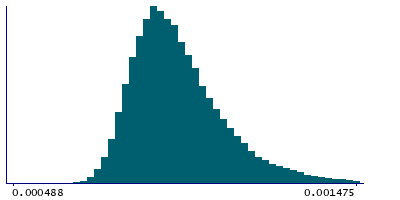
2 Instances
Instance 2 : Imaging visit (2014+)
79,153 participants, 79,153 items
| Maximum | 0.003117 |
| Decile 9 | 0.001162 |
| Decile 8 | 0.001075 |
| Decile 7 | 0.00102 |
| Decile 6 | 0.000981 |
| Median | 0.000947 |
| Decile 4 | 0.000917 |
| Decile 3 | 0.000888 |
| Decile 2 | 0.000858 |
| Decile 1 | 0.000819 |
| Minimum | 0 |
|

|
- Mean = 0.000974392
- Std.dev = 0.000147722
- 4 items below graph minimum of 0.000476
- 515 items above graph maximum of 0.001505
|
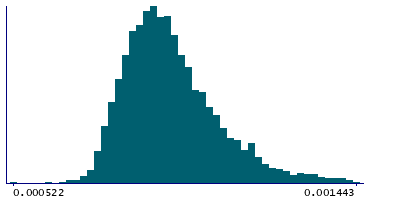
Instance 3 : First repeat imaging visit (2019+)
4,758 participants, 4,758 items
| Maximum | 0.001817 |
| Decile 9 | 0.001124 |
| Decile 8 | 0.001043 |
| Decile 7 | 0.0009925 |
| Decile 6 | 0.000956 |
| Median | 0.000927 |
| Decile 4 | 0.0008985 |
| Decile 3 | 0.000872 |
| Decile 2 | 0.000842 |
| Decile 1 | 0.000805 |
| Minimum | 0.000522 |
|
|
- Mean = 0.00094992
- Std.dev = 0.000134965
- 26 items above graph maximum of 0.001443
|
Notes
Mean MD (mean diffusivity) in tapetum (left) on FA (fractional anisotropy) skeleton (from dMRI data)
0 Related Data-Fields
There are no related data-fields
2 Applications
| Application ID | Title |
|---|
| 17689 | Genetic, environmental and lifestyle predictors of brain/cognitive-related outcomes. |
| 22783 | The joint analysis of imaging data and genetic data for early tumor detection, prevention, diagnosis and treatment |

