Data
83,911 items of data are available, covering 79,384 participants.
Defined-instances run from 2 to 3, labelled using Instancing
2.
Units of measurement are AU.
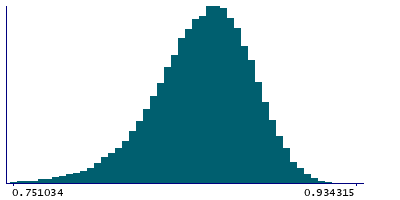
| Maximum | 0.934315 |
| Decile 9 | 0.883086 |
| Decile 8 | 0.873772 |
| Decile 7 | 0.866581 |
| Decile 6 | 0.860137 |
| Median | 0.853824 |
| Decile 4 | 0.847192 |
| Decile 3 | 0.839856 |
| Decile 2 | 0.830761 |
| Decile 1 | 0.816903 |
| Minimum | -0.142403 |
|
|
- Mean = 0.850951
- Std.dev = 0.0306665
- 320 items below graph minimum of 0.750719
|
2 Instances
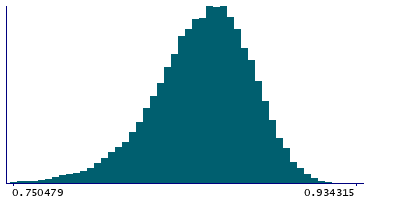
Instance 2 : Imaging visit (2014+)
79,153 participants, 79,153 items
| Maximum | 0.934315 |
| Decile 9 | 0.883117 |
| Decile 8 | 0.873802 |
| Decile 7 | 0.866568 |
| Decile 6 | 0.860123 |
| Median | 0.853833 |
| Decile 4 | 0.847152 |
| Decile 3 | 0.839819 |
| Decile 2 | 0.830755 |
| Decile 1 | 0.816911 |
| Minimum | -0.142403 |
|
|
- Mean = 0.850938
- Std.dev = 0.0307751
- 304 items below graph minimum of 0.750705
|
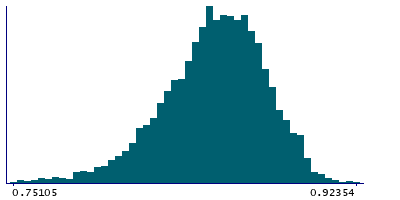
Instance 3 : First repeat imaging visit (2019+)
4,758 participants, 4,758 items
| Maximum | 0.92354 |
| Decile 9 | 0.882579 |
| Decile 8 | 0.873491 |
| Decile 7 | 0.866931 |
| Decile 6 | 0.860362 |
| Median | 0.853769 |
| Decile 4 | 0.847884 |
| Decile 3 | 0.840664 |
| Decile 2 | 0.831027 |
| Decile 1 | 0.816806 |
| Minimum | 0.399568 |
|
|
- Mean = 0.851165
- Std.dev = 0.0287989
- 16 items below graph minimum of 0.751032
|
Notes
Mean MO (diffusion tensor mode) in superior cerebellar peduncle (right) on FA (fractional anisotropy) skeleton (from dMRI data)
0 Related Data-Fields
There are no related data-fields
2 Applications
| Application ID | Title |
|---|
| 17689 | Genetic, environmental and lifestyle predictors of brain/cognitive-related outcomes. |
| 22783 | The joint analysis of imaging data and genetic data for early tumor detection, prevention, diagnosis and treatment |

