Data
83,911 items of data are available, covering 79,384 participants.
Defined-instances run from 2 to 3, labelled using Instancing
2.
Units of measurement are AU.
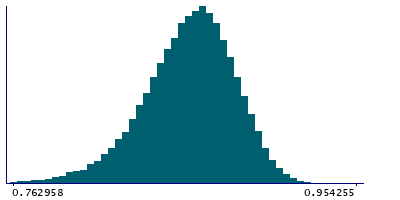
| Maximum | 0.954255 |
| Decile 9 | 0.890848 |
| Decile 8 | 0.881624 |
| Decile 7 | 0.874697 |
| Decile 6 | 0.868529 |
| Median | 0.862449 |
| Decile 4 | 0.855997 |
| Decile 3 | 0.848763 |
| Decile 2 | 0.839935 |
| Decile 1 | 0.826321 |
| Minimum | 0 |
|
|
- Mean = 0.859494
- Std.dev = 0.0302509
- 358 items below graph minimum of 0.761794
|
2 Instances
Instance 2 : Imaging visit (2014+)
79,153 participants, 79,153 items
| Maximum | 0.954255 |
| Decile 9 | 0.890842 |
| Decile 8 | 0.881637 |
| Decile 7 | 0.874726 |
| Decile 6 | 0.86859 |
| Median | 0.862481 |
| Decile 4 | 0.856025 |
| Decile 3 | 0.848771 |
| Decile 2 | 0.839938 |
| Decile 1 | 0.826268 |
| Minimum | 0 |
|

|
- Mean = 0.859494
- Std.dev = 0.0303361
- 342 items below graph minimum of 0.761695
|
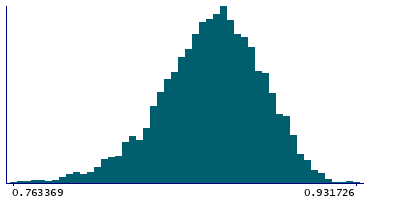
Instance 3 : First repeat imaging visit (2019+)
4,758 participants, 4,758 items
| Maximum | 0.931726 |
| Decile 9 | 0.890973 |
| Decile 8 | 0.881408 |
| Decile 7 | 0.874189 |
| Decile 6 | 0.867771 |
| Median | 0.861846 |
| Decile 4 | 0.855603 |
| Decile 3 | 0.848588 |
| Decile 2 | 0.839875 |
| Decile 1 | 0.827159 |
| Minimum | 0.327002 |
|
|
- Mean = 0.85949
- Std.dev = 0.0287957
- 17 items below graph minimum of 0.763345
|
Notes
Mean MO (diffusion tensor mode) in superior cerebellar peduncle (left) on FA (fractional anisotropy) skeleton (from dMRI data)
0 Related Data-Fields
There are no related data-fields
2 Applications
| Application ID | Title |
|---|
| 17689 | Genetic, environmental and lifestyle predictors of brain/cognitive-related outcomes. |
| 22783 | The joint analysis of imaging data and genetic data for early tumor detection, prevention, diagnosis and treatment |

