Data
83,911 items of data are available, covering 79,384 participants.
Defined-instances run from 2 to 3, labelled using Instancing
2.
Units of measurement are AU.
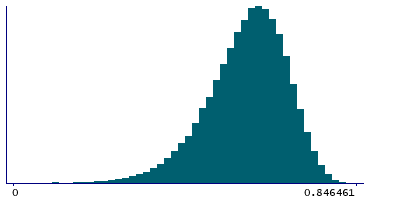
| Maximum | 0.846461 |
| Decile 9 | 0.687156 |
| Decile 8 | 0.653766 |
| Decile 7 | 0.62739 |
| Decile 6 | 0.603142 |
| Median | 0.578858 |
| Decile 4 | 0.553158 |
| Decile 3 | 0.524079 |
| Decile 2 | 0.487356 |
| Decile 1 | 0.432152 |
| Minimum | -0.190548 |
|
|
- Mean = 0.567272
- Std.dev = 0.102143
- 11 items below graph minimum of 0
|
2 Instances
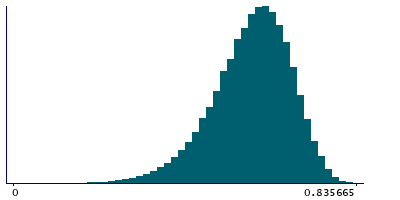
Instance 2 : Imaging visit (2014+)
79,153 participants, 79,153 items
| Maximum | 0.846461 |
| Decile 9 | 0.686832 |
| Decile 8 | 0.653425 |
| Decile 7 | 0.626816 |
| Decile 6 | 0.602588 |
| Median | 0.578183 |
| Decile 4 | 0.552381 |
| Decile 3 | 0.523226 |
| Decile 2 | 0.486149 |
| Decile 1 | 0.430819 |
| Minimum | -0.190548 |
|
|
- Mean = 0.566554
- Std.dev = 0.102439
- 10 items below graph minimum of 0
|
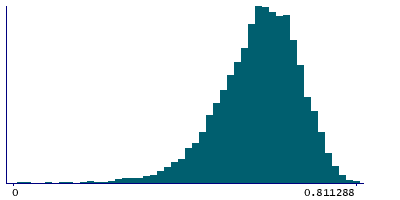
Instance 3 : First repeat imaging visit (2019+)
4,758 participants, 4,758 items
| Maximum | 0.811288 |
| Decile 9 | 0.692074 |
| Decile 8 | 0.659469 |
| Decile 7 | 0.635752 |
| Decile 6 | 0.611368 |
| Median | 0.588848 |
| Decile 4 | 0.566701 |
| Decile 3 | 0.539694 |
| Decile 2 | 0.5048 |
| Decile 1 | 0.45454 |
| Minimum | -0.008623 |
|
|
- Mean = 0.579226
- Std.dev = 0.0963153
- 1 item below graph minimum of 0
|
Notes
Mean MO (diffusion tensor mode) in fornix cres+stria terminalis (right) on FA (fractional anisotropy) skeleton (from dMRI data)
0 Related Data-Fields
There are no related data-fields
2 Applications
| Application ID | Title |
|---|
| 17689 | Genetic, environmental and lifestyle predictors of brain/cognitive-related outcomes. |
| 22783 | The joint analysis of imaging data and genetic data for early tumor detection, prevention, diagnosis and treatment |

