Data
83,911 items of data are available, covering 79,384 participants.
Defined-instances run from 2 to 3, labelled using Instancing
2.
Units of measurement are AU.
| Maximum | 0.926071 |
| Decile 9 | 0.812917 |
| Decile 8 | 0.785969 |
| Decile 7 | 0.763651 |
| Decile 6 | 0.742409 |
| Median | 0.720788 |
| Decile 4 | 0.697409 |
| Decile 3 | 0.670444 |
| Decile 2 | 0.635088 |
| Decile 1 | 0.579751 |
| Minimum | -0.238349 |
|
|
- Mean = 0.705827
- Std.dev = 0.0963811
- 355 items below graph minimum of 0.346585
|
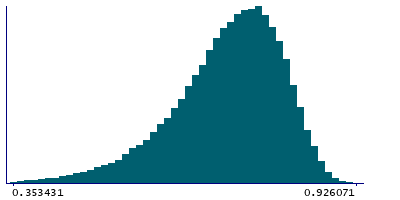
2 Instances
Instance 2 : Imaging visit (2014+)
79,153 participants, 79,153 items
| Maximum | 0.926071 |
| Decile 9 | 0.812839 |
| Decile 8 | 0.785778 |
| Decile 7 | 0.763454 |
| Decile 6 | 0.742036 |
| Median | 0.72037 |
| Decile 4 | 0.696929 |
| Decile 3 | 0.670086 |
| Decile 2 | 0.634731 |
| Decile 1 | 0.579163 |
| Minimum | -0.238349 |
|

|
- Mean = 0.705492
- Std.dev = 0.096505
- 337 items below graph minimum of 0.345487
|
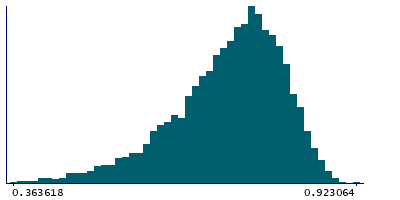
Instance 3 : First repeat imaging visit (2019+)
4,758 participants, 4,758 items
| Maximum | 0.923064 |
| Decile 9 | 0.814094 |
| Decile 8 | 0.789185 |
| Decile 7 | 0.767226 |
| Decile 6 | 0.748586 |
| Median | 0.727694 |
| Decile 4 | 0.703901 |
| Decile 3 | 0.677231 |
| Decile 2 | 0.642683 |
| Decile 1 | 0.588694 |
| Minimum | -0.045273 |
|
|
- Mean = 0.711397
- Std.dev = 0.0941212
- 16 items below graph minimum of 0.363294
|
Notes
Mean MO (diffusion tensor mode) in uncinate fasciculus (left) on FA (fractional anisotropy) skeleton (from dMRI data)
0 Related Data-Fields
There are no related data-fields
2 Applications
| Application ID | Title |
|---|
| 17689 | Genetic, environmental and lifestyle predictors of brain/cognitive-related outcomes. |
| 22783 | The joint analysis of imaging data and genetic data for early tumor detection, prevention, diagnosis and treatment |

