Data
83,911 items of data are available, covering 79,384 participants.
Defined-instances run from 2 to 3, labelled using Instancing
2.
Units of measurement are AU.
| Maximum | 0.003887 |
| Decile 9 | 0.002721 |
| Decile 8 | 0.0025625 |
| Decile 7 | 0.002468 |
| Decile 6 | 0.002394 |
| Median | 0.00233 |
| Decile 4 | 0.002272 |
| Decile 3 | 0.002213 |
| Decile 2 | 0.002149 |
| Decile 1 | 0.002068 |
| Minimum | 0.00105 |
|

|
- Mean = 0.002368
- Std.dev = 0.000262214
- 8 items below graph minimum of 0.001415
- 75 items above graph maximum of 0.003374
|
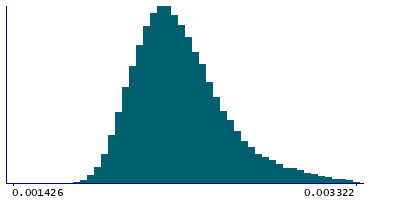
2 Instances
Instance 2 : Imaging visit (2014+)
79,153 participants, 79,153 items
| Maximum | 0.003887 |
| Decile 9 | 0.002724 |
| Decile 8 | 0.002565 |
| Decile 7 | 0.00247 |
| Decile 6 | 0.002396 |
| Median | 0.002333 |
| Decile 4 | 0.002274 |
| Decile 3 | 0.002215 |
| Decile 2 | 0.002151 |
| Decile 1 | 0.00207 |
| Minimum | 0.00105 |
|
|
- Mean = 0.00237008
- Std.dev = 0.000262496
- 7 items below graph minimum of 0.001416
- 66 items above graph maximum of 0.003378
|
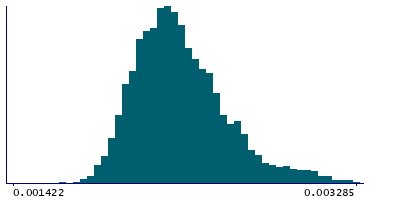
Instance 3 : First repeat imaging visit (2019+)
4,758 participants, 4,758 items
| Maximum | 0.003447 |
| Decile 9 | 0.002664 |
| Decile 8 | 0.002519 |
| Decile 7 | 0.0024295 |
| Decile 6 | 0.002356 |
| Median | 0.002296 |
| Decile 4 | 0.00224 |
| Decile 3 | 0.002185 |
| Decile 2 | 0.0021205 |
| Decile 1 | 0.002043 |
| Minimum | 0.001363 |
|
|
- Mean = 0.00233336
- Std.dev = 0.000254987
- 1 item below graph minimum of 0.001422
- 12 items above graph maximum of 0.003285
|
Notes
Mean L1 in fornix on FA (fractional anisotropy) skeleton (from dMRI data)
0 Related Data-Fields
There are no related data-fields
2 Applications
| Application ID | Title |
|---|
| 17689 | Genetic, environmental and lifestyle predictors of brain/cognitive-related outcomes. |
| 22783 | The joint analysis of imaging data and genetic data for early tumor detection, prevention, diagnosis and treatment |

