Data
83,911 items of data are available, covering 79,384 participants.
Defined-instances run from 2 to 3, labelled using Instancing
2.
Units of measurement are AU.
| Maximum | 0.003368 |
| Decile 9 | 0.001953 |
| Decile 8 | 0.001862 |
| Decile 7 | 0.001807 |
| Decile 6 | 0.001765 |
| Median | 0.001728 |
| Decile 4 | 0.001695 |
| Decile 3 | 0.00166 |
| Decile 2 | 0.001621 |
| Decile 1 | 0.00157 |
| Minimum | 0 |
|

|
- Mean = 0.00174929
- Std.dev = 0.000160843
- 6 items below graph minimum of 0.001187
- 354 items above graph maximum of 0.002336
|
2 Instances
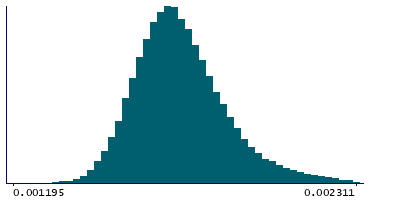
Instance 2 : Imaging visit (2014+)
79,153 participants, 79,153 items
| Maximum | 0.003368 |
| Decile 9 | 0.001955 |
| Decile 8 | 0.001865 |
| Decile 7 | 0.001809 |
| Decile 6 | 0.001766 |
| Median | 0.00173 |
| Decile 4 | 0.001696 |
| Decile 3 | 0.001662 |
| Decile 2 | 0.001623 |
| Decile 1 | 0.001571 |
| Minimum | 0 |
|
|
- Mean = 0.00175105
- Std.dev = 0.000161224
- 6 items below graph minimum of 0.001187
- 329 items above graph maximum of 0.002339
|
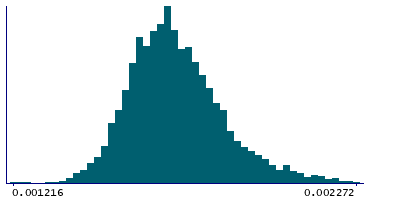
Instance 3 : First repeat imaging visit (2019+)
4,758 participants, 4,758 items
| Maximum | 0.002565 |
| Decile 9 | 0.001911 |
| Decile 8 | 0.001828 |
| Decile 7 | 0.001777 |
| Decile 6 | 0.001737 |
| Median | 0.0017 |
| Decile 4 | 0.001671 |
| Decile 3 | 0.001636 |
| Decile 2 | 0.001598 |
| Decile 1 | 0.00155 |
| Minimum | 0.001216 |
|
|
- Mean = 0.00171994
- Std.dev = 0.000151372
- 23 items above graph maximum of 0.002272
|
Notes
Mean L1 in tapetum (right) on FA (fractional anisotropy) skeleton (from dMRI data)
0 Related Data-Fields
There are no related data-fields
2 Applications
| Application ID | Title |
|---|
| 17689 | Genetic, environmental and lifestyle predictors of brain/cognitive-related outcomes. |
| 22783 | The joint analysis of imaging data and genetic data for early tumor detection, prevention, diagnosis and treatment |

