Data
83,911 items of data are available, covering 79,384 participants.
Defined-instances run from 2 to 3, labelled using Instancing
2.
Units of measurement are AU.
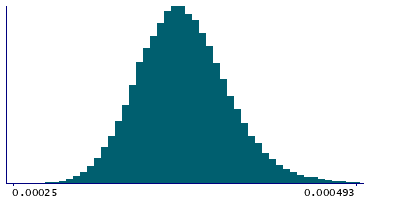
| Maximum | 0.001456 |
| Decile 9 | 0.000413 |
| Decile 8 | 0.000396 |
| Decile 7 | 0.000385 |
| Decile 6 | 0.000376 |
| Median | 0.000368 |
| Decile 4 | 0.000361 |
| Decile 3 | 0.000352 |
| Decile 2 | 0.000343 |
| Decile 1 | 0.00033 |
| Minimum | 0.000225 |
|
|
- Mean = 0.000370989
- Std.dev = 3.62074e-05
- 2 items below graph minimum of 0.000247
- 470 items above graph maximum of 0.000496
|
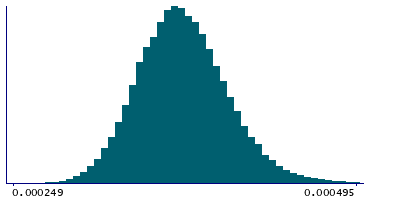
2 Instances
Instance 2 : Imaging visit (2014+)
79,153 participants, 79,153 items
| Maximum | 0.001456 |
| Decile 9 | 0.000413 |
| Decile 8 | 0.000396 |
| Decile 7 | 0.000385 |
| Decile 6 | 0.000377 |
| Median | 0.000368 |
| Decile 4 | 0.000361 |
| Decile 3 | 0.000352 |
| Decile 2 | 0.000343 |
| Decile 1 | 0.00033 |
| Minimum | 0.000225 |
|
|
- Mean = 0.000371127
- Std.dev = 3.63971e-05
- 2 items below graph minimum of 0.000247
- 458 items above graph maximum of 0.000496
|
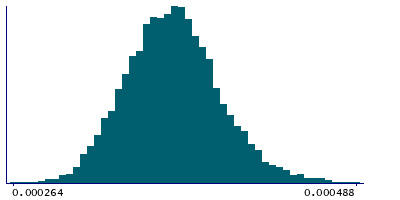
Instance 3 : First repeat imaging visit (2019+)
4,758 participants, 4,758 items
| Maximum | 0.000768 |
| Decile 9 | 0.000409 |
| Decile 8 | 0.000393 |
| Decile 7 | 0.000383 |
| Decile 6 | 0.000375 |
| Median | 0.000367 |
| Decile 4 | 0.000359 |
| Decile 3 | 0.000352 |
| Decile 2 | 0.000342 |
| Decile 1 | 0.00033 |
| Minimum | 0.000264 |
|
|
- Mean = 0.000368697
- Std.dev = 3.28074e-05
- 15 items above graph maximum of 0.000488
|
Notes
Mean L2 in splenium of corpus callosum on FA (fractional anisotropy) skeleton (from dMRI data)
0 Related Data-Fields
There are no related data-fields
2 Applications
| Application ID | Title |
|---|
| 17689 | Genetic, environmental and lifestyle predictors of brain/cognitive-related outcomes. |
| 22783 | The joint analysis of imaging data and genetic data for early tumor detection, prevention, diagnosis and treatment |

