Data
83,911 items of data are available, covering 79,384 participants.
Defined-instances run from 2 to 3, labelled using Instancing
2.
Units of measurement are AU.
| Maximum | 0.003142 |
| Decile 9 | 0.001004 |
| Decile 8 | 0.000905 |
| Decile 7 | 0.000848 |
| Decile 6 | 0.000806 |
| Median | 0.00077 |
| Decile 4 | 0.000737 |
| Decile 3 | 0.000705 |
| Decile 2 | 0.00067 |
| Decile 1 | 0.000626 |
| Minimum | 0 |
|
|
- Mean = 0.000797717
- Std.dev = 0.000161975
- 536 items above graph maximum of 0.001382
|
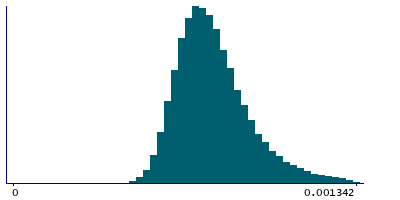
2 Instances
Instance 2 : Imaging visit (2014+)
79,153 participants, 79,153 items
| Maximum | 0.003142 |
| Decile 9 | 0.001006 |
| Decile 8 | 0.000907 |
| Decile 7 | 0.000849 |
| Decile 6 | 0.000807 |
| Median | 0.000771 |
| Decile 4 | 0.000738 |
| Decile 3 | 0.000706 |
| Decile 2 | 0.00067 |
| Decile 1 | 0.000627 |
| Minimum | 0 |
|

|
- Mean = 0.000798901
- Std.dev = 0.000162616
- 500 items above graph maximum of 0.001385
|
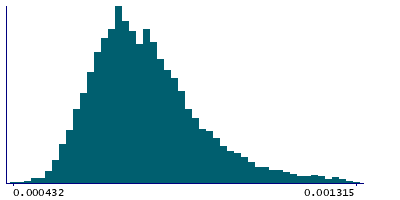
Instance 3 : First repeat imaging visit (2019+)
4,758 participants, 4,758 items
| Maximum | 0.001784 |
| Decile 9 | 0.0009665 |
| Decile 8 | 0.000878 |
| Decile 7 | 0.000828 |
| Decile 6 | 0.000788 |
| Median | 0.000754 |
| Decile 4 | 0.000721 |
| Decile 3 | 0.000692 |
| Decile 2 | 0.000659 |
| Decile 1 | 0.000617 |
| Minimum | 0.000432 |
|
|
- Mean = 0.000778026
- Std.dev = 0.000149547
- 29 items above graph maximum of 0.001316
|
Notes
Mean L2 in tapetum (right) on FA (fractional anisotropy) skeleton (from dMRI data)
0 Related Data-Fields
There are no related data-fields
2 Applications
| Application ID | Title |
|---|
| 17689 | Genetic, environmental and lifestyle predictors of brain/cognitive-related outcomes. |
| 22783 | The joint analysis of imaging data and genetic data for early tumor detection, prevention, diagnosis and treatment |

