Data
83,911 items of data are available, covering 79,384 participants.
Defined-instances run from 2 to 3, labelled using Instancing
2.
Units of measurement are AU.
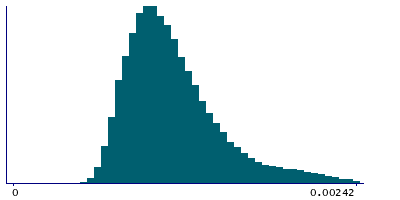
| Maximum | 0.003232 |
| Decile 9 | 0.001667 |
| Decile 8 | 0.001418 |
| Decile 7 | 0.00128 |
| Decile 6 | 0.001181 |
| Median | 0.0010995 |
| Decile 4 | 0.001026 |
| Decile 3 | 0.000954 |
| Decile 2 | 0.00088 |
| Decile 1 | 0.000791 |
| Minimum | 0.000418 |
|
|
- Mean = 0.00117518
- Std.dev = 0.000364756
- 265 items above graph maximum of 0.002543
|
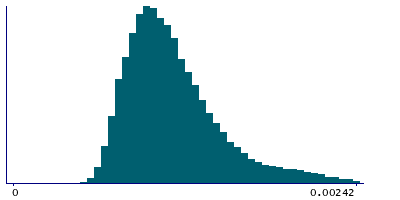
2 Instances
Instance 2 : Imaging visit (2014+)
79,153 participants, 79,153 items
| Maximum | 0.003232 |
| Decile 9 | 0.001671 |
| Decile 8 | 0.001422 |
| Decile 7 | 0.001283 |
| Decile 6 | 0.001183 |
| Median | 0.001102 |
| Decile 4 | 0.001028 |
| Decile 3 | 0.000955 |
| Decile 2 | 0.000881 |
| Decile 1 | 0.000792 |
| Minimum | 0.000418 |
|
|
- Mean = 0.00117748
- Std.dev = 0.000365634
- 236 items above graph maximum of 0.00255
|
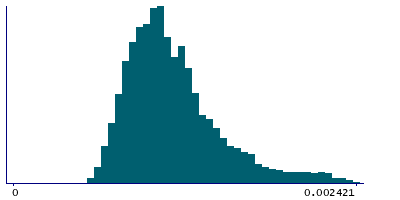
Instance 3 : First repeat imaging visit (2019+)
4,758 participants, 4,758 items
| Maximum | 0.002854 |
| Decile 9 | 0.001598 |
| Decile 8 | 0.001362 |
| Decile 7 | 0.001231 |
| Decile 6 | 0.001145 |
| Median | 0.001063 |
| Decile 4 | 0.001 |
| Decile 3 | 0.000934 |
| Decile 2 | 0.000861 |
| Decile 1 | 0.0007755 |
| Minimum | 0.000478 |
|
|
- Mean = 0.00113705
- Std.dev = 0.000347606
- 24 items above graph maximum of 0.0024205
|
Notes
Mean L3 in fornix on FA (fractional anisotropy) skeleton (from dMRI data)
0 Related Data-Fields
There are no related data-fields
2 Applications
| Application ID | Title |
|---|
| 17689 | Genetic, environmental and lifestyle predictors of brain/cognitive-related outcomes. |
| 22783 | The joint analysis of imaging data and genetic data for early tumor detection, prevention, diagnosis and treatment |

