Data
83,911 items of data are available, covering 79,384 participants.
Defined-instances run from 2 to 3, labelled using Instancing
2.
Units of measurement are AU.
| Maximum | 0.001645 |
| Decile 9 | 0.000504 |
| Decile 8 | 0.000468 |
| Decile 7 | 0.000445 |
| Decile 6 | 0.000427 |
| Median | 0.000411 |
| Decile 4 | 0.000395 |
| Decile 3 | 0.000379 |
| Decile 2 | 0.000361 |
| Decile 1 | 0.00034 |
| Minimum | 0 |
|

|
- Mean = 0.000417862
- Std.dev = 6.70874e-05
- 6 items below graph minimum of 0.000176
- 267 items above graph maximum of 0.000668
|
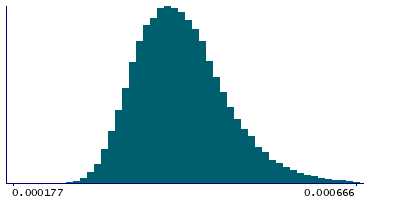
2 Instances
Instance 2 : Imaging visit (2014+)
79,153 participants, 79,153 items
| Maximum | 0.001645 |
| Decile 9 | 0.000504 |
| Decile 8 | 0.000468 |
| Decile 7 | 0.000446 |
| Decile 6 | 0.000427 |
| Median | 0.000411 |
| Decile 4 | 0.000395 |
| Decile 3 | 0.000379 |
| Decile 2 | 0.000361 |
| Decile 1 | 0.00034 |
| Minimum | 0 |
|
|
- Mean = 0.000417999
- Std.dev = 6.70881e-05
- 5 items below graph minimum of 0.000176
- 256 items above graph maximum of 0.000668
|
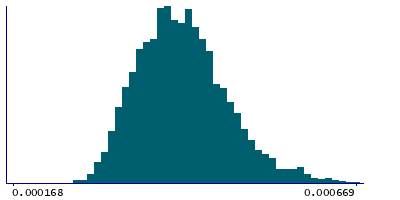
Instance 3 : First repeat imaging visit (2019+)
4,758 participants, 4,758 items
| Maximum | 0.000794 |
| Decile 9 | 0.000502 |
| Decile 8 | 0.000468 |
| Decile 7 | 0.000445 |
| Decile 6 | 0.000426 |
| Median | 0.00041 |
| Decile 4 | 0.000393 |
| Decile 3 | 0.000378 |
| Decile 2 | 0.000358 |
| Decile 1 | 0.000335 |
| Minimum | 7.6e-05 |
|
|
- Mean = 0.000415587
- Std.dev = 6.70347e-05
- 1 item below graph minimum of 0.000168
- 11 items above graph maximum of 0.000669
|
Notes
Mean L3 in corticospinal tract (left) on FA (fractional anisotropy) skeleton (from dMRI data)
0 Related Data-Fields
There are no related data-fields
2 Applications
| Application ID | Title |
|---|
| 17689 | Genetic, environmental and lifestyle predictors of brain/cognitive-related outcomes. |
| 22783 | The joint analysis of imaging data and genetic data for early tumor detection, prevention, diagnosis and treatment |

