Data
83,911 items of data are available, covering 79,384 participants.
Defined-instances run from 2 to 3, labelled using Instancing
2.
Units of measurement are AU.
| Maximum | 0.001022 |
| Decile 9 | 0.000381 |
| Decile 8 | 0.000363 |
| Decile 7 | 0.000351 |
| Decile 6 | 0.000341 |
| Median | 0.000333 |
| Decile 4 | 0.000324 |
| Decile 3 | 0.000315 |
| Decile 2 | 0.000306 |
| Decile 1 | 0.000292 |
| Minimum | 0 |
|
|
- Mean = 0.000335387
- Std.dev = 3.67022e-05
- 7 items below graph minimum of 0.000203
- 206 items above graph maximum of 0.00047
|
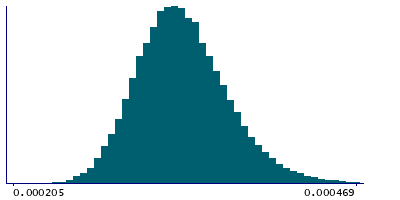
2 Instances
Instance 2 : Imaging visit (2014+)
79,153 participants, 79,153 items
| Maximum | 0.001022 |
| Decile 9 | 0.000382 |
| Decile 8 | 0.000364 |
| Decile 7 | 0.000351 |
| Decile 6 | 0.000342 |
| Median | 0.000333 |
| Decile 4 | 0.000324 |
| Decile 3 | 0.000316 |
| Decile 2 | 0.000306 |
| Decile 1 | 0.000293 |
| Minimum | 0 |
|

|
- Mean = 0.000335661
- Std.dev = 3.67831e-05
- 6 items below graph minimum of 0.000204
- 197 items above graph maximum of 0.000471
|
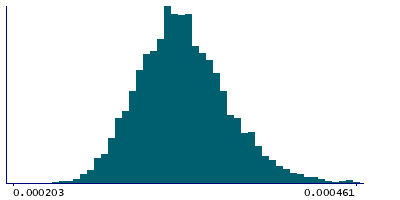
Instance 3 : First repeat imaging visit (2019+)
4,758 participants, 4,758 items
| Maximum | 0.000767 |
| Decile 9 | 0.000375 |
| Decile 8 | 0.000357 |
| Decile 7 | 0.000346 |
| Decile 6 | 0.000336 |
| Median | 0.000328 |
| Decile 4 | 0.000321 |
| Decile 3 | 0.000312 |
| Decile 2 | 0.000302 |
| Decile 1 | 0.000289 |
| Minimum | 0.000181 |
|
|
- Mean = 0.000330843
- Std.dev = 3.50192e-05
- 1 item below graph minimum of 0.000203
- 8 items above graph maximum of 0.000461
|
Notes
Mean L3 in superior cerebellar peduncle (right) on FA (fractional anisotropy) skeleton (from dMRI data)
0 Related Data-Fields
There are no related data-fields
2 Applications
| Application ID | Title |
|---|
| 17689 | Genetic, environmental and lifestyle predictors of brain/cognitive-related outcomes. |
| 22783 | The joint analysis of imaging data and genetic data for early tumor detection, prevention, diagnosis and treatment |

