Data
83,911 items of data are available, covering 79,384 participants.
Defined-instances run from 2 to 3, labelled using Instancing
2.
Units of measurement are AU.
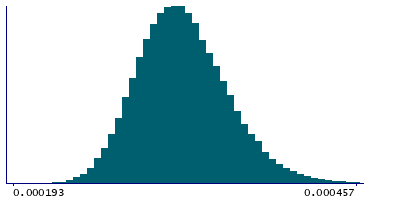
| Maximum | 0.00136 |
| Decile 9 | 0.000369 |
| Decile 8 | 0.000351 |
| Decile 7 | 0.000339 |
| Decile 6 | 0.000329 |
| Median | 0.000321 |
| Decile 4 | 0.000312 |
| Decile 3 | 0.000303 |
| Decile 2 | 0.000294 |
| Decile 1 | 0.000281 |
| Minimum | 0 |
|
|
- Mean = 0.000323374
- Std.dev = 3.65312e-05
- 6 items below graph minimum of 0.000193
- 188 items above graph maximum of 0.000457
|
2 Instances
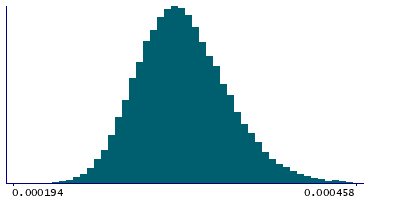
Instance 2 : Imaging visit (2014+)
79,153 participants, 79,153 items
| Maximum | 0.00136 |
| Decile 9 | 0.000369 |
| Decile 8 | 0.000352 |
| Decile 7 | 0.00034 |
| Decile 6 | 0.00033 |
| Median | 0.000321 |
| Decile 4 | 0.000312 |
| Decile 3 | 0.000304 |
| Decile 2 | 0.000294 |
| Decile 1 | 0.000281 |
| Minimum | 0 |
|
|
- Mean = 0.000323683
- Std.dev = 3.66139e-05
- 4 items below graph minimum of 0.000193
- 184 items above graph maximum of 0.000457
|
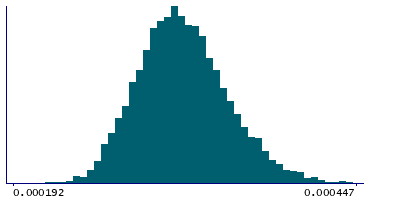
Instance 3 : First repeat imaging visit (2019+)
4,758 participants, 4,758 items
| Maximum | 0.000927 |
| Decile 9 | 0.000362 |
| Decile 8 | 0.000345 |
| Decile 7 | 0.000333 |
| Decile 6 | 0.0003245 |
| Median | 0.000316 |
| Decile 4 | 0.000308 |
| Decile 3 | 0.000299 |
| Decile 2 | 0.00029 |
| Decile 1 | 0.000277 |
| Minimum | 0.000125 |
|
|
- Mean = 0.000318246
- Std.dev = 3.47281e-05
- 2 items below graph minimum of 0.000192
- 7 items above graph maximum of 0.000447
|
Notes
Mean L3 in superior cerebellar peduncle (left) on FA (fractional anisotropy) skeleton (from dMRI data)
0 Related Data-Fields
There are no related data-fields
2 Applications
| Application ID | Title |
|---|
| 17689 | Genetic, environmental and lifestyle predictors of brain/cognitive-related outcomes. |
| 22783 | The joint analysis of imaging data and genetic data for early tumor detection, prevention, diagnosis and treatment |

