Data
83,911 items of data are available, covering 79,384 participants.
Defined-instances run from 2 to 3, labelled using Instancing
2.
Units of measurement are AU.
| Maximum | 0.002018 |
| Decile 9 | 0.000513 |
| Decile 8 | 0.000495 |
| Decile 7 | 0.000482 |
| Decile 6 | 0.000472 |
| Median | 0.000463 |
| Decile 4 | 0.000454 |
| Decile 3 | 0.000445 |
| Decile 2 | 0.000433 |
| Decile 1 | 0.000418 |
| Minimum | 0 |
|
|
- Mean = 0.000465026
- Std.dev = 4.09778e-05
- 19 items below graph minimum of 0.000323
- 259 items above graph maximum of 0.000608
|
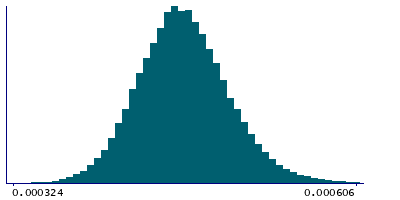
2 Instances
Instance 2 : Imaging visit (2014+)
79,153 participants, 79,153 items
| Maximum | 0.002018 |
| Decile 9 | 0.000514 |
| Decile 8 | 0.000495 |
| Decile 7 | 0.000483 |
| Decile 6 | 0.000473 |
| Median | 0.000463 |
| Decile 4 | 0.000454 |
| Decile 3 | 0.000445 |
| Decile 2 | 0.000433 |
| Decile 1 | 0.000418 |
| Minimum | 0 |
|

|
- Mean = 0.000465264
- Std.dev = 4.09315e-05
- 18 items below graph minimum of 0.000322
- 232 items above graph maximum of 0.00061
|
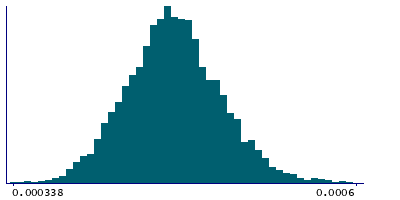
Instance 3 : First repeat imaging visit (2019+)
4,758 participants, 4,758 items
| Maximum | 0.001761 |
| Decile 9 | 0.000507 |
| Decile 8 | 0.000491 |
| Decile 7 | 0.000478 |
| Decile 6 | 0.000468 |
| Median | 0.00046 |
| Decile 4 | 0.000451 |
| Decile 3 | 0.000442 |
| Decile 2 | 0.00043 |
| Decile 1 | 0.000414 |
| Minimum | 0.000338 |
|
|
- Mean = 0.000461073
- Std.dev = 4.15405e-05
- 11 items above graph maximum of 0.0006
|
Notes
Mean L3 in cingulum hippocampus (right) on FA (fractional anisotropy) skeleton (from dMRI data)
0 Related Data-Fields
There are no related data-fields
2 Applications
| Application ID | Title |
|---|
| 17689 | Genetic, environmental and lifestyle predictors of brain/cognitive-related outcomes. |
| 22783 | The joint analysis of imaging data and genetic data for early tumor detection, prevention, diagnosis and treatment |

