Data
83,906 items of data are available, covering 79,379 participants.
Defined-instances run from 2 to 3, labelled using Instancing
2.
Units of measurement are AU.
| Maximum | 0.99 |
| Decile 9 | 0.705231 |
| Decile 8 | 0.692446 |
| Decile 7 | 0.683182 |
| Decile 6 | 0.675243 |
| Median | 0.668208 |
| Decile 4 | 0.661128 |
| Decile 3 | 0.653625 |
| Decile 2 | 0.644666 |
| Decile 1 | 0.632304 |
| Minimum | 0 |
|

|
- Mean = 0.66869
- Std.dev = 0.0296104
- 31 items below graph minimum of 0.559377
- 64 items above graph maximum of 0.778158
|
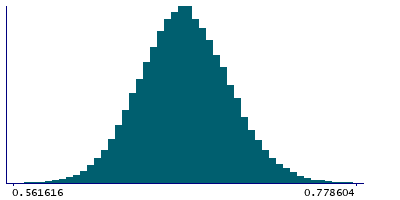
2 Instances
Instance 2 : Imaging visit (2014+)
79,148 participants, 79,148 items
| Maximum | 0.99 |
| Decile 9 | 0.704538 |
| Decile 8 | 0.691772 |
| Decile 7 | 0.682543 |
| Decile 6 | 0.67467 |
| Median | 0.667659 |
| Decile 4 | 0.660583 |
| Decile 3 | 0.653108 |
| Decile 2 | 0.644126 |
| Decile 1 | 0.631853 |
| Minimum | 0 |
|
|
- Mean = 0.668106
- Std.dev = 0.0295408
- 31 items below graph minimum of 0.559168
- 62 items above graph maximum of 0.777224
|
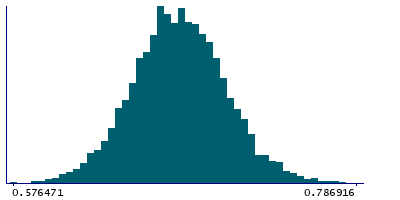
Instance 3 : First repeat imaging visit (2019+)
4,758 participants, 4,758 items
| Maximum | 0.919892 |
| Decile 9 | 0.714545 |
| Decile 8 | 0.701855 |
| Decile 7 | 0.692753 |
| Decile 6 | 0.685196 |
| Median | 0.677973 |
| Decile 4 | 0.670354 |
| Decile 3 | 0.663559 |
| Decile 2 | 0.654422 |
| Decile 1 | 0.642267 |
| Minimum | 0.576471 |
|
|
- Mean = 0.678394
- Std.dev = 0.0290753
- 5 items above graph maximum of 0.786823
|
Notes
Mean ICVF (intra-cellular volume fraction) in inferior cerebellar peduncle (left) on FA (fractional anisotropy) skeleton (from dMRI data)
0 Related Data-Fields
There are no related data-fields
2 Applications
| Application ID | Title |
|---|
| 17689 | Genetic, environmental and lifestyle predictors of brain/cognitive-related outcomes. |
| 22783 | The joint analysis of imaging data and genetic data for early tumor detection, prevention, diagnosis and treatment |

