Data
83,906 items of data are available, covering 79,379 participants.
Defined-instances run from 2 to 3, labelled using Instancing
2.
Units of measurement are AU.
| Maximum | 0.99 |
| Decile 9 | 0.785486 |
| Decile 8 | 0.771574 |
| Decile 7 | 0.761821 |
| Decile 6 | 0.753262 |
| Median | 0.745487 |
| Decile 4 | 0.737701 |
| Decile 3 | 0.729335 |
| Decile 2 | 0.719866 |
| Decile 1 | 0.706398 |
| Minimum | 0 |
|

|
- Mean = 0.745804
- Std.dev = 0.0318913
- 24 items below graph minimum of 0.627309
- 57 items above graph maximum of 0.864574
|
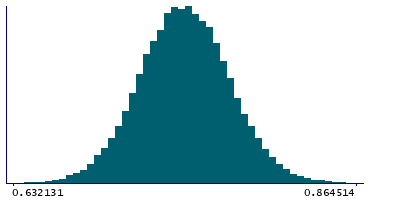
2 Instances
Instance 2 : Imaging visit (2014+)
79,148 participants, 79,148 items
| Maximum | 0.99 |
| Decile 9 | 0.78512 |
| Decile 8 | 0.771157 |
| Decile 7 | 0.761505 |
| Decile 6 | 0.752976 |
| Median | 0.745184 |
| Decile 4 | 0.737386 |
| Decile 3 | 0.72897 |
| Decile 2 | 0.719557 |
| Decile 1 | 0.706095 |
| Minimum | 0 |
|
|
- Mean = 0.745483
- Std.dev = 0.0319079
- 24 items below graph minimum of 0.62707
- 54 items above graph maximum of 0.864146
|
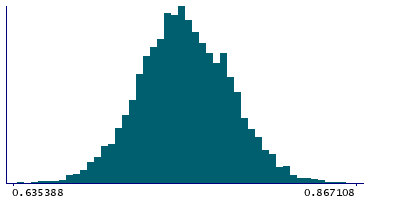
Instance 3 : First repeat imaging visit (2019+)
4,758 participants, 4,758 items
| Maximum | 0.989576 |
| Decile 9 | 0.789875 |
| Decile 8 | 0.777503 |
| Decile 7 | 0.76717 |
| Decile 6 | 0.758044 |
| Median | 0.750127 |
| Decile 4 | 0.742867 |
| Decile 3 | 0.734916 |
| Decile 2 | 0.725249 |
| Decile 1 | 0.712622 |
| Minimum | 0.633289 |
|
|
- Mean = 0.751151
- Std.dev = 0.0311305
- 1 item below graph minimum of 0.63537
- 4 items above graph maximum of 0.867128
|
Notes
Mean ICVF (intra-cellular volume fraction) in cerebral peduncle (left) on FA (fractional anisotropy) skeleton (from dMRI data)
0 Related Data-Fields
There are no related data-fields
2 Applications
| Application ID | Title |
|---|
| 17689 | Genetic, environmental and lifestyle predictors of brain/cognitive-related outcomes. |
| 22783 | The joint analysis of imaging data and genetic data for early tumor detection, prevention, diagnosis and treatment |

