Data
83,906 items of data are available, covering 79,379 participants.
Defined-instances run from 2 to 3, labelled using Instancing
2.
Units of measurement are AU.
| Maximum | 0.99 |
| Decile 9 | 0.686344 |
| Decile 8 | 0.67183 |
| Decile 7 | 0.660882 |
| Decile 6 | 0.651321 |
| Median | 0.642034 |
| Decile 4 | 0.632385 |
| Decile 3 | 0.621725 |
| Decile 2 | 0.608352 |
| Decile 1 | 0.587822 |
| Minimum | 0.309509 |
|
|
- Mean = 0.638647
- Std.dev = 0.0415578
- 414 items below graph minimum of 0.489301
- 35 items above graph maximum of 0.784866
|
2 Instances
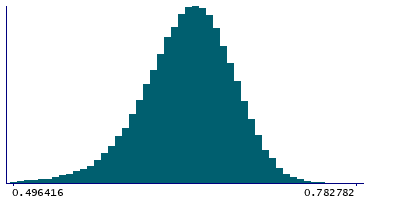
Instance 2 : Imaging visit (2014+)
79,148 participants, 79,148 items
| Maximum | 0.99 |
| Decile 9 | 0.686148 |
| Decile 8 | 0.671712 |
| Decile 7 | 0.660753 |
| Decile 6 | 0.651101 |
| Median | 0.641757 |
| Decile 4 | 0.632111 |
| Decile 3 | 0.621476 |
| Decile 2 | 0.607969 |
| Decile 1 | 0.587327 |
| Minimum | 0.309509 |
|

|
- Mean = 0.638378
- Std.dev = 0.0416743
- 390 items below graph minimum of 0.488505
- 32 items above graph maximum of 0.784969
|
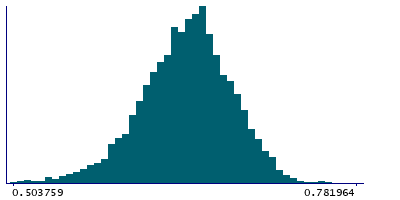
Instance 3 : First repeat imaging visit (2019+)
4,758 participants, 4,758 items
| Maximum | 0.96975 |
| Decile 9 | 0.689229 |
| Decile 8 | 0.674311 |
| Decile 7 | 0.662784 |
| Decile 6 | 0.654305 |
| Median | 0.645894 |
| Decile 4 | 0.636457 |
| Decile 3 | 0.626279 |
| Decile 2 | 0.614234 |
| Decile 1 | 0.596487 |
| Minimum | 0.324568 |
|
|
- Mean = 0.643125
- Std.dev = 0.0392993
- 22 items below graph minimum of 0.503745
- 3 items above graph maximum of 0.781972
|
Notes
Mean ICVF (intra-cellular volume fraction) in superior corona radiata (left) on FA (fractional anisotropy) skeleton (from dMRI data)
0 Related Data-Fields
There are no related data-fields
2 Applications
| Application ID | Title |
|---|
| 17689 | Genetic, environmental and lifestyle predictors of brain/cognitive-related outcomes. |
| 22783 | The joint analysis of imaging data and genetic data for early tumor detection, prevention, diagnosis and treatment |

