Data
83,906 items of data are available, covering 79,379 participants.
Defined-instances run from 2 to 3, labelled using Instancing
2.
Units of measurement are AU.
| Maximum | 0.99 |
| Decile 9 | 0.594769 |
| Decile 8 | 0.576774 |
| Decile 7 | 0.563237 |
| Decile 6 | 0.55161 |
| Median | 0.540393 |
| Decile 4 | 0.528686 |
| Decile 3 | 0.515588 |
| Decile 2 | 0.498934 |
| Decile 1 | 0.472441 |
| Minimum | 0.201882 |
|
|
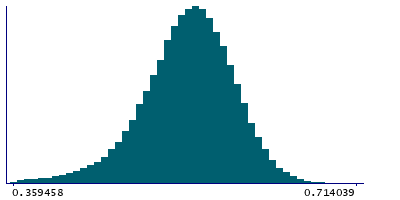
- Mean = 0.535777
- Std.dev = 0.0518517
- 428 items below graph minimum of 0.350113
- 37 items above graph maximum of 0.717097
|
2 Instances
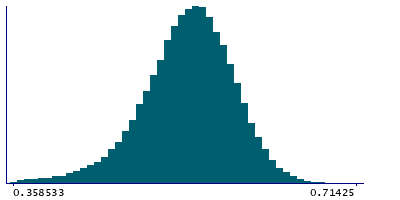
Instance 2 : Imaging visit (2014+)
79,148 participants, 79,148 items
| Maximum | 0.99 |
| Decile 9 | 0.594556 |
| Decile 8 | 0.576595 |
| Decile 7 | 0.562988 |
| Decile 6 | 0.551427 |
| Median | 0.540106 |
| Decile 4 | 0.528344 |
| Decile 3 | 0.515178 |
| Decile 2 | 0.498345 |
| Decile 1 | 0.471861 |
| Minimum | 0.201882 |
|
|
- Mean = 0.535416
- Std.dev = 0.0520086
- 395 items below graph minimum of 0.349167
- 34 items above graph maximum of 0.71725
|
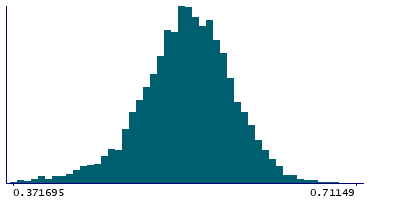
Instance 3 : First repeat imaging visit (2019+)
4,758 participants, 4,758 items
| Maximum | 0.928576 |
| Decile 9 | 0.59824 |
| Decile 8 | 0.579682 |
| Decile 7 | 0.567111 |
| Decile 6 | 0.555558 |
| Median | 0.544714 |
| Decile 4 | 0.534178 |
| Decile 3 | 0.522512 |
| Decile 2 | 0.507073 |
| Decile 1 | 0.484943 |
| Minimum | 0.275962 |
|
|
- Mean = 0.541778
- Std.dev = 0.0487781
- 30 items below graph minimum of 0.371647
- 3 items above graph maximum of 0.711536
|
Notes
Mean ICVF (intra-cellular volume fraction) in posterior corona radiata (right) on FA (fractional anisotropy) skeleton (from dMRI data)
0 Related Data-Fields
There are no related data-fields
2 Applications
| Application ID | Title |
|---|
| 17689 | Genetic, environmental and lifestyle predictors of brain/cognitive-related outcomes. |
| 22783 | The joint analysis of imaging data and genetic data for early tumor detection, prevention, diagnosis and treatment |

