Data
83,906 items of data are available, covering 79,379 participants.
Defined-instances run from 2 to 3, labelled using Instancing
2.
Units of measurement are AU.
| Maximum | 0.99 |
| Decile 9 | 0.606122 |
| Decile 8 | 0.588617 |
| Decile 7 | 0.575573 |
| Decile 6 | 0.564377 |
| Median | 0.553689 |
| Decile 4 | 0.542326 |
| Decile 3 | 0.529797 |
| Decile 2 | 0.514004 |
| Decile 1 | 0.489211 |
| Minimum | 0.221945 |
|

|
- Mean = 0.549426
- Std.dev = 0.049622
- 474 items below graph minimum of 0.3723
- 35 items above graph maximum of 0.723033
|
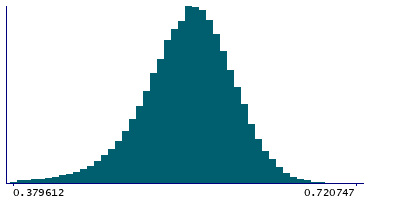
2 Instances
Instance 2 : Imaging visit (2014+)
79,148 participants, 79,148 items
| Maximum | 0.99 |
| Decile 9 | 0.605983 |
| Decile 8 | 0.588412 |
| Decile 7 | 0.575346 |
| Decile 6 | 0.564157 |
| Median | 0.553443 |
| Decile 4 | 0.541994 |
| Decile 3 | 0.52945 |
| Decile 2 | 0.513576 |
| Decile 1 | 0.488664 |
| Minimum | 0.221945 |
|
|
- Mean = 0.54911
- Std.dev = 0.0497906
- 446 items below graph minimum of 0.371344
- 32 items above graph maximum of 0.723303
|
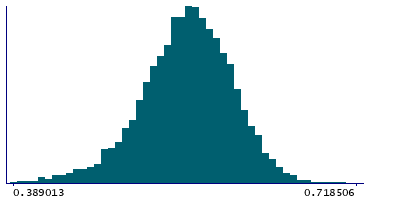
Instance 3 : First repeat imaging visit (2019+)
4,758 participants, 4,758 items
| Maximum | 0.869295 |
| Decile 9 | 0.60868 |
| Decile 8 | 0.591627 |
| Decile 7 | 0.579154 |
| Decile 6 | 0.567703 |
| Median | 0.557416 |
| Decile 4 | 0.547076 |
| Decile 3 | 0.535 |
| Decile 2 | 0.520455 |
| Decile 1 | 0.498721 |
| Minimum | 0.260565 |
|
|
- Mean = 0.554674
- Std.dev = 0.0464132
- 23 items below graph minimum of 0.388761
- 3 items above graph maximum of 0.71864
|
Notes
Mean ICVF (intra-cellular volume fraction) in posterior corona radiata (left) on FA (fractional anisotropy) skeleton (from dMRI data)
0 Related Data-Fields
There are no related data-fields
2 Applications
| Application ID | Title |
|---|
| 17689 | Genetic, environmental and lifestyle predictors of brain/cognitive-related outcomes. |
| 22783 | The joint analysis of imaging data and genetic data for early tumor detection, prevention, diagnosis and treatment |

