Data
83,906 items of data are available, covering 79,379 participants.
Defined-instances run from 2 to 3, labelled using Instancing
2.
Units of measurement are AU.
| Maximum | 0.99 |
| Decile 9 | 0.612917 |
| Decile 8 | 0.59766 |
| Decile 7 | 0.587225 |
| Decile 6 | 0.578119 |
| Median | 0.569562 |
| Decile 4 | 0.561246 |
| Decile 3 | 0.552154 |
| Decile 2 | 0.541592 |
| Decile 1 | 0.527189 |
| Minimum | 0 |
|

|
- Mean = 0.569917
- Std.dev = 0.0352007
- 43 items below graph minimum of 0.441461
- 68 items above graph maximum of 0.698645
|
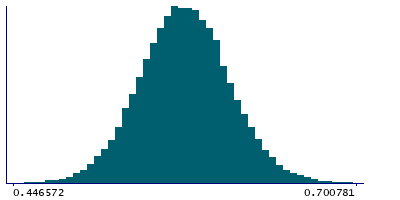
2 Instances
Instance 2 : Imaging visit (2014+)
79,148 participants, 79,148 items
| Maximum | 0.99 |
| Decile 9 | 0.61241 |
| Decile 8 | 0.59716 |
| Decile 7 | 0.586653 |
| Decile 6 | 0.577627 |
| Median | 0.568951 |
| Decile 4 | 0.560634 |
| Decile 3 | 0.551565 |
| Decile 2 | 0.541022 |
| Decile 1 | 0.52664 |
| Minimum | 0 |
|
|
- Mean = 0.569349
- Std.dev = 0.0352157
- 41 items below graph minimum of 0.44087
- 65 items above graph maximum of 0.69818
|
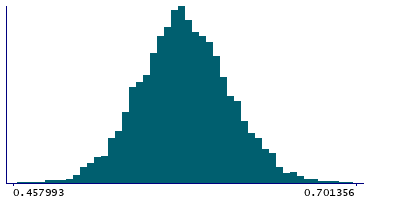
Instance 3 : First repeat imaging visit (2019+)
4,758 participants, 4,758 items
| Maximum | 0.9785 |
| Decile 9 | 0.620227 |
| Decile 8 | 0.605596 |
| Decile 7 | 0.595533 |
| Decile 6 | 0.58648 |
| Median | 0.578502 |
| Decile 4 | 0.571052 |
| Decile 3 | 0.562515 |
| Decile 2 | 0.552343 |
| Decile 1 | 0.539112 |
| Minimum | 0.411489 |
|
|
- Mean = 0.579371
- Std.dev = 0.0335676
- 2 items below graph minimum of 0.457998
- 4 items above graph maximum of 0.701341
|
Notes
Mean ICVF (intra-cellular volume fraction) in fornix cres+stria terminalis (left) on FA (fractional anisotropy) skeleton (from dMRI data)
0 Related Data-Fields
There are no related data-fields
2 Applications
| Application ID | Title |
|---|
| 17689 | Genetic, environmental and lifestyle predictors of brain/cognitive-related outcomes. |
| 22783 | The joint analysis of imaging data and genetic data for early tumor detection, prevention, diagnosis and treatment |

