Data
83,906 items of data are available, covering 79,379 participants.
Defined-instances run from 2 to 3, labelled using Instancing
2.
Units of measurement are AU.
| Maximum | 0.655125 |
| Decile 9 | 0.2646 |
| Decile 8 | 0.249233 |
| Decile 7 | 0.238266 |
| Decile 6 | 0.228672 |
| Median | 0.219935 |
| Decile 4 | 0.211056 |
| Decile 3 | 0.201543 |
| Decile 2 | 0.190842 |
| Decile 1 | 0.176537 |
| Minimum | 0 |
|
|
- Mean = 0.220369
- Std.dev = 0.0343288
- 3 items below graph minimum of 0.088474
- 30 items above graph maximum of 0.352663
|
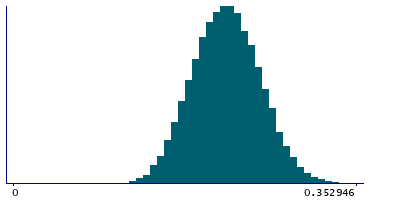
2 Instances
Instance 2 : Imaging visit (2014+)
79,148 participants, 79,148 items
| Maximum | 0.558051 |
| Decile 9 | 0.264489 |
| Decile 8 | 0.249025 |
| Decile 7 | 0.238007 |
| Decile 6 | 0.228419 |
| Median | 0.219681 |
| Decile 4 | 0.21072 |
| Decile 3 | 0.201162 |
| Decile 2 | 0.190479 |
| Decile 1 | 0.176183 |
| Minimum | 0 |
|

|
- Mean = 0.220082
- Std.dev = 0.0343731
- 26 items above graph maximum of 0.352794
|
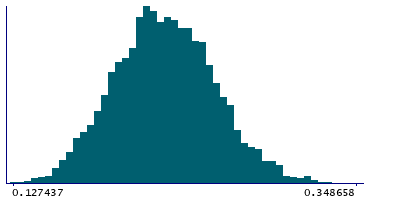
Instance 3 : First repeat imaging visit (2019+)
4,758 participants, 4,758 items
| Maximum | 0.655125 |
| Decile 9 | 0.266178 |
| Decile 8 | 0.251869 |
| Decile 7 | 0.241972 |
| Decile 6 | 0.232891 |
| Median | 0.224329 |
| Decile 4 | 0.215709 |
| Decile 3 | 0.207615 |
| Decile 2 | 0.196959 |
| Decile 1 | 0.183668 |
| Minimum | 0.127437 |
|
|
- Mean = 0.225129
- Std.dev = 0.033224
- 4 items above graph maximum of 0.348688
|
Notes
Mean OD (orientation dispersion index) in pontine crossing tract on FA (fractional anisotropy) skeleton (from dMRI data)
0 Related Data-Fields
There are no related data-fields
2 Applications
| Application ID | Title |
|---|
| 17689 | Genetic, environmental and lifestyle predictors of brain/cognitive-related outcomes. |
| 22783 | The joint analysis of imaging data and genetic data for early tumor detection, prevention, diagnosis and treatment |

