Data
83,906 items of data are available, covering 79,379 participants.
Defined-instances run from 2 to 3, labelled using Instancing
2.
Units of measurement are AU.
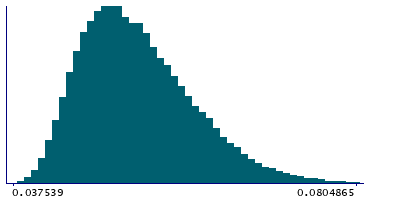
| Maximum | 0.699526 |
| Decile 9 | 0.0624725 |
| Decile 8 | 0.058569 |
| Decile 7 | 0.0558795 |
| Decile 6 | 0.0537665 |
| Median | 0.051923 |
| Decile 4 | 0.050241 |
| Decile 3 | 0.048589 |
| Decile 2 | 0.046883 |
| Decile 1 | 0.044858 |
| Minimum | 0.037366 |
|
|
- Mean = 0.0530589
- Std.dev = 0.00905122
- 208 items above graph maximum of 0.080087
|
2 Instances
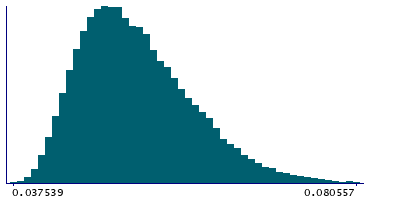
Instance 2 : Imaging visit (2014+)
79,148 participants, 79,148 items
| Maximum | 0.494076 |
| Decile 9 | 0.0624075 |
| Decile 8 | 0.0584965 |
| Decile 7 | 0.055809 |
| Decile 6 | 0.0537115 |
| Median | 0.051868 |
| Decile 4 | 0.050183 |
| Decile 3 | 0.048549 |
| Decile 2 | 0.04684 |
| Decile 1 | 0.044828 |
| Minimum | 0.037366 |
|
|
- Mean = 0.0529994
- Std.dev = 0.00878975
- 194 items above graph maximum of 0.079987
|
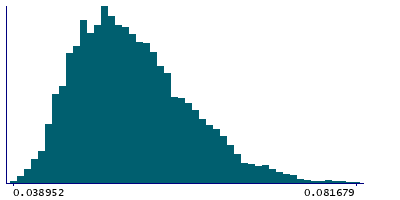
Instance 3 : First repeat imaging visit (2019+)
4,758 participants, 4,758 items
| Maximum | 0.699526 |
| Decile 9 | 0.0636085 |
| Decile 8 | 0.059636 |
| Decile 7 | 0.0568555 |
| Decile 6 | 0.0547365 |
| Median | 0.052854 |
| Decile 4 | 0.0510875 |
| Decile 3 | 0.0494195 |
| Decile 2 | 0.047576 |
| Decile 1 | 0.0455405 |
| Minimum | 0.038952 |
|
|
- Mean = 0.0540481
- Std.dev = 0.0125891
- 12 items above graph maximum of 0.0816765
|
Notes
Mean OD (orientation dispersion index) in splenium of corpus callosum on FA (fractional anisotropy) skeleton (from dMRI data)
0 Related Data-Fields
There are no related data-fields
2 Applications
| Application ID | Title |
|---|
| 17689 | Genetic, environmental and lifestyle predictors of brain/cognitive-related outcomes. |
| 22783 | The joint analysis of imaging data and genetic data for early tumor detection, prevention, diagnosis and treatment |

