Data
83,906 items of data are available, covering 79,379 participants.
Defined-instances run from 2 to 3, labelled using Instancing
2.
Units of measurement are AU.
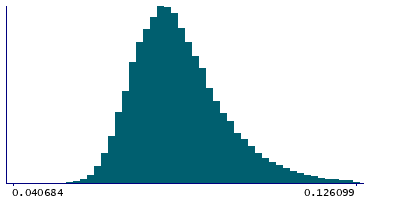
| Maximum | 0.564459 |
| Decile 9 | 0.098291 |
| Decile 8 | 0.091159 |
| Decile 7 | 0.0867925 |
| Decile 6 | 0.0834435 |
| Median | 0.080628 |
| Decile 4 | 0.07803 |
| Decile 3 | 0.075422 |
| Decile 2 | 0.072599 |
| Decile 1 | 0.06913 |
| Minimum | 0 |
|
|
- Mean = 0.0825724
- Std.dev = 0.0128907
- 3 items below graph minimum of 0.039969
- 443 items above graph maximum of 0.127452
|
2 Instances
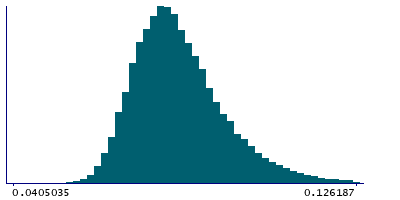
Instance 2 : Imaging visit (2014+)
79,148 participants, 79,148 items
| Maximum | 0.564459 |
| Decile 9 | 0.0983425 |
| Decile 8 | 0.0911425 |
| Decile 7 | 0.0867645 |
| Decile 6 | 0.083407 |
| Median | 0.080568 |
| Decile 4 | 0.077965 |
| Decile 3 | 0.075366 |
| Decile 2 | 0.072545 |
| Decile 1 | 0.0690625 |
| Minimum | 0 |
|
|
- Mean = 0.0825348
- Std.dev = 0.0128918
- 3 items below graph minimum of 0.0397825
- 412 items above graph maximum of 0.127622
|
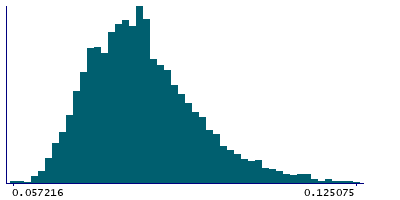
Instance 3 : First repeat imaging visit (2019+)
4,758 participants, 4,758 items
| Maximum | 0.465819 |
| Decile 9 | 0.0976695 |
| Decile 8 | 0.0913185 |
| Decile 7 | 0.0872295 |
| Decile 6 | 0.083903 |
| Median | 0.081627 |
| Decile 4 | 0.079101 |
| Decile 3 | 0.0765145 |
| Decile 2 | 0.0735115 |
| Decile 1 | 0.070239 |
| Minimum | 0.057216 |
|
|
- Mean = 0.0831982
- Std.dev = 0.012857
- 31 items above graph maximum of 0.1251
|
Notes
Mean OD (orientation dispersion index) in posterior thalamic radiation (right) on FA (fractional anisotropy) skeleton (from dMRI data)
0 Related Data-Fields
There are no related data-fields
2 Applications
| Application ID | Title |
|---|
| 17689 | Genetic, environmental and lifestyle predictors of brain/cognitive-related outcomes. |
| 22783 | The joint analysis of imaging data and genetic data for early tumor detection, prevention, diagnosis and treatment |

