Data
83,909 items of data are available, covering 79,382 participants.
Defined-instances run from 2 to 3, labelled using Instancing
2.
Units of measurement are AU.
| Maximum | 0.553684 |
| Decile 9 | 0.488342 |
| Decile 8 | 0.479407 |
| Decile 7 | 0.47291 |
| Decile 6 | 0.467258 |
| Median | 0.462022 |
| Decile 4 | 0.456558 |
| Decile 3 | 0.450686 |
| Decile 2 | 0.443439 |
| Decile 1 | 0.433117 |
| Minimum | 0 |
|

|
- Mean = 0.46109
- Std.dev = 0.0228613
- 90 items below graph minimum of 0.377893
- 4 items above graph maximum of 0.543566
|
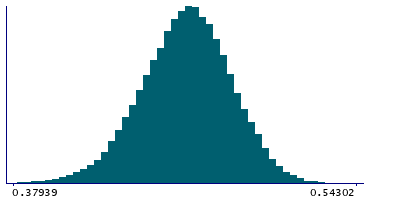
2 Instances
Instance 2 : Imaging visit (2014+)
79,151 participants, 79,151 items
| Maximum | 0.553684 |
| Decile 9 | 0.488291 |
| Decile 8 | 0.479346 |
| Decile 7 | 0.472831 |
| Decile 6 | 0.467179 |
| Median | 0.461921 |
| Decile 4 | 0.456472 |
| Decile 3 | 0.45057 |
| Decile 2 | 0.4433 |
| Decile 1 | 0.432945 |
| Minimum | 0 |
|
|
- Mean = 0.460988
- Std.dev = 0.022909
- 84 items below graph minimum of 0.377598
- 4 items above graph maximum of 0.543638
|
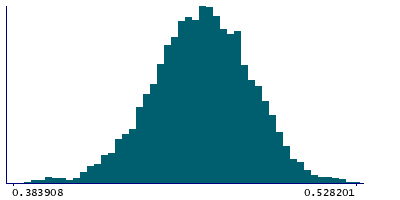
Instance 3 : First repeat imaging visit (2019+)
4,758 participants, 4,758 items
| Maximum | 0.528201 |
| Decile 9 | 0.489154 |
| Decile 8 | 0.48046 |
| Decile 7 | 0.474269 |
| Decile 6 | 0.468649 |
| Median | 0.463432 |
| Decile 4 | 0.457958 |
| Decile 3 | 0.45238 |
| Decile 2 | 0.446013 |
| Decile 1 | 0.436516 |
| Minimum | 0 |
|
|
- Mean = 0.462781
- Std.dev = 0.0219837
- 6 items below graph minimum of 0.383878
|
Notes
Weighted-mean FA (fractional anisotropy) in tract forceps minor (from dMRI data)
0 Related Data-Fields
There are no related data-fields
2 Applications
| Application ID | Title |
|---|
| 17689 | Genetic, environmental and lifestyle predictors of brain/cognitive-related outcomes. |
| 22783 | The joint analysis of imaging data and genetic data for early tumor detection, prevention, diagnosis and treatment |

