Data
83,909 items of data are available, covering 79,382 participants.
Defined-instances run from 2 to 3, labelled using Instancing
2.
Units of measurement are AU.
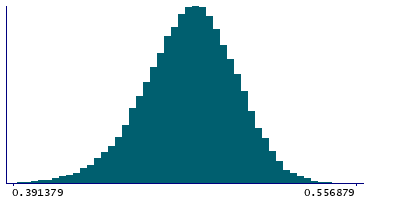
| Maximum | 0.560541 |
| Decile 9 | 0.503911 |
| Decile 8 | 0.494954 |
| Decile 7 | 0.488194 |
| Decile 6 | 0.48244 |
| Median | 0.476871 |
| Decile 4 | 0.471225 |
| Decile 3 | 0.464959 |
| Decile 2 | 0.457428 |
| Decile 1 | 0.446429 |
| Minimum | 0 |
|
|
- Mean = 0.475629
- Std.dev = 0.0242638
- 129 items below graph minimum of 0.388948
|
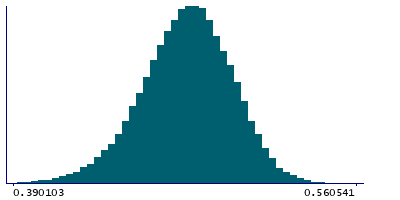
2 Instances
Instance 2 : Imaging visit (2014+)
79,151 participants, 79,151 items
| Maximum | 0.560541 |
| Decile 9 | 0.503883 |
| Decile 8 | 0.494878 |
| Decile 7 | 0.488097 |
| Decile 6 | 0.482339 |
| Median | 0.476774 |
| Decile 4 | 0.471094 |
| Decile 3 | 0.464831 |
| Decile 2 | 0.457267 |
| Decile 1 | 0.446233 |
| Minimum | 0 |
|
|
- Mean = 0.475525
- Std.dev = 0.024272
- 121 items below graph minimum of 0.388583
|
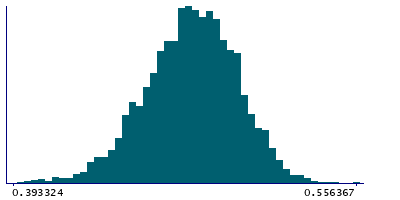
Instance 3 : First repeat imaging visit (2019+)
4,758 participants, 4,758 items
| Maximum | 0.556367 |
| Decile 9 | 0.504432 |
| Decile 8 | 0.496166 |
| Decile 7 | 0.489617 |
| Decile 6 | 0.484148 |
| Median | 0.478669 |
| Decile 4 | 0.4733 |
| Decile 3 | 0.466988 |
| Decile 2 | 0.459616 |
| Decile 1 | 0.448875 |
| Minimum | 0 |
|
|
- Mean = 0.477358
- Std.dev = 0.0240609
- 6 items below graph minimum of 0.393319
|
Notes
Weighted-mean FA (fractional anisotropy) in tract left inferior fronto-occipital fasciculus (from dMRI data)
0 Related Data-Fields
There are no related data-fields
2 Applications
| Application ID | Title |
|---|
| 17689 | Genetic, environmental and lifestyle predictors of brain/cognitive-related outcomes. |
| 22783 | The joint analysis of imaging data and genetic data for early tumor detection, prevention, diagnosis and treatment |

