Data
83,909 items of data are available, covering 79,382 participants.
Defined-instances run from 2 to 3, labelled using Instancing
2.
Units of measurement are AU.
| Maximum | 0.544002 |
| Decile 9 | 0.488886 |
| Decile 8 | 0.480271 |
| Decile 7 | 0.473967 |
| Decile 6 | 0.468535 |
| Median | 0.463328 |
| Decile 4 | 0.457983 |
| Decile 3 | 0.452166 |
| Decile 2 | 0.445303 |
| Decile 1 | 0.43506 |
| Minimum | 0 |
|

|
- Mean = 0.462268
- Std.dev = 0.0227558
- 129 items below graph minimum of 0.381233
- 1 item above graph maximum of 0.542712
|
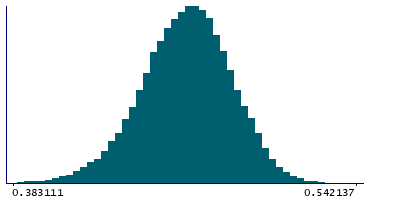
2 Instances
Instance 2 : Imaging visit (2014+)
79,151 participants, 79,151 items
| Maximum | 0.544002 |
| Decile 9 | 0.48891 |
| Decile 8 | 0.480279 |
| Decile 7 | 0.473926 |
| Decile 6 | 0.468514 |
| Median | 0.4633 |
| Decile 4 | 0.457924 |
| Decile 3 | 0.452092 |
| Decile 2 | 0.445225 |
| Decile 1 | 0.434931 |
| Minimum | 0 |
|
|
- Mean = 0.46222
- Std.dev = 0.02277
- 122 items below graph minimum of 0.380951
- 1 item above graph maximum of 0.54289
|
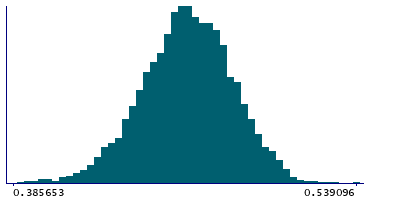
Instance 3 : First repeat imaging visit (2019+)
4,758 participants, 4,758 items
| Maximum | 0.539096 |
| Decile 9 | 0.488539 |
| Decile 8 | 0.480176 |
| Decile 7 | 0.474344 |
| Decile 6 | 0.469012 |
| Median | 0.463866 |
| Decile 4 | 0.458865 |
| Decile 3 | 0.453572 |
| Decile 2 | 0.446387 |
| Decile 1 | 0.437086 |
| Minimum | 0 |
|
|
- Mean = 0.463068
- Std.dev = 0.0225028
- 5 items below graph minimum of 0.385633
|
Notes
Weighted-mean FA (fractional anisotropy) in tract right inferior fronto-occipital fasciculus (from dMRI data)
0 Related Data-Fields
There are no related data-fields
2 Applications
| Application ID | Title |
|---|
| 17689 | Genetic, environmental and lifestyle predictors of brain/cognitive-related outcomes. |
| 22783 | The joint analysis of imaging data and genetic data for early tumor detection, prevention, diagnosis and treatment |

