Data
83,909 items of data are available, covering 79,382 participants.
Defined-instances run from 2 to 3, labelled using Instancing
2.
Units of measurement are AU.
| Maximum | 0.642451 |
| Decile 9 | 0.517177 |
| Decile 8 | 0.505159 |
| Decile 7 | 0.496735 |
| Decile 6 | 0.489536 |
| Median | 0.482821 |
| Decile 4 | 0.476036 |
| Decile 3 | 0.468731 |
| Decile 2 | 0.460301 |
| Decile 1 | 0.448234 |
| Minimum | 0 |
|
|
- Mean = 0.482471
- Std.dev = 0.0301815
- 159 items below graph minimum of 0.37929
- 56 items above graph maximum of 0.586121
|
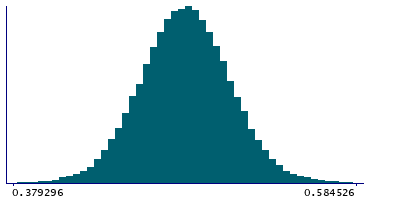
2 Instances
Instance 2 : Imaging visit (2014+)
79,151 participants, 79,151 items
| Maximum | 0.642451 |
| Decile 9 | 0.517254 |
| Decile 8 | 0.505226 |
| Decile 7 | 0.496841 |
| Decile 6 | 0.489656 |
| Median | 0.482945 |
| Decile 4 | 0.476124 |
| Decile 3 | 0.468811 |
| Decile 2 | 0.460344 |
| Decile 1 | 0.448261 |
| Minimum | 0 |
|

|
- Mean = 0.482528
- Std.dev = 0.0302066
- 156 items below graph minimum of 0.379267
- 55 items above graph maximum of 0.586248
|
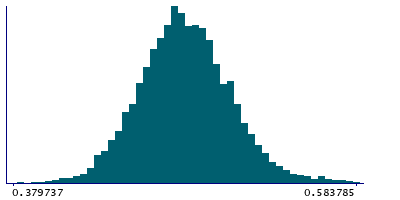
Instance 3 : First repeat imaging visit (2019+)
4,758 participants, 4,758 items
| Maximum | 0.587074 |
| Decile 9 | 0.515757 |
| Decile 8 | 0.503575 |
| Decile 7 | 0.494821 |
| Decile 6 | 0.487725 |
| Median | 0.480836 |
| Decile 4 | 0.474763 |
| Decile 3 | 0.467834 |
| Decile 2 | 0.459638 |
| Decile 1 | 0.447759 |
| Minimum | 0 |
|
|
- Mean = 0.481532
- Std.dev = 0.0297454
- 3 items below graph minimum of 0.379762
- 1 item above graph maximum of 0.583754
|
Notes
Weighted-mean FA (fractional anisotropy) in tract middle cerebellar peduncle (from dMRI data)
0 Related Data-Fields
There are no related data-fields
2 Applications
| Application ID | Title |
|---|
| 17689 | Genetic, environmental and lifestyle predictors of brain/cognitive-related outcomes. |
| 22783 | The joint analysis of imaging data and genetic data for early tumor detection, prevention, diagnosis and treatment |

