Data
83,909 items of data are available, covering 79,382 participants.
Defined-instances run from 2 to 3, labelled using Instancing
2.
Units of measurement are AU.
| Maximum | 0.659651 |
| Decile 9 | 0.470241 |
| Decile 8 | 0.461676 |
| Decile 7 | 0.455252 |
| Decile 6 | 0.449822 |
| Median | 0.444564 |
| Decile 4 | 0.439153 |
| Decile 3 | 0.433225 |
| Decile 2 | 0.425848 |
| Decile 1 | 0.415167 |
| Minimum | 0 |
|
|
- Mean = 0.443278
- Std.dev = 0.0224495
- 201 items below graph minimum of 0.360092
- 7 items above graph maximum of 0.525315
|
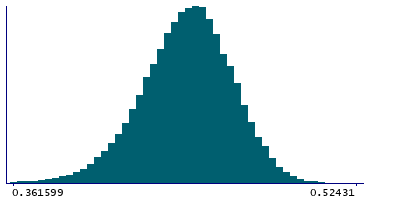
2 Instances
Instance 2 : Imaging visit (2014+)
79,151 participants, 79,151 items
| Maximum | 0.659651 |
| Decile 9 | 0.470115 |
| Decile 8 | 0.461522 |
| Decile 7 | 0.455136 |
| Decile 6 | 0.449733 |
| Median | 0.444419 |
| Decile 4 | 0.439006 |
| Decile 3 | 0.433064 |
| Decile 2 | 0.425655 |
| Decile 1 | 0.414917 |
| Minimum | 0 |
|

|
- Mean = 0.443119
- Std.dev = 0.0225183
- 195 items below graph minimum of 0.359719
- 7 items above graph maximum of 0.525314
|
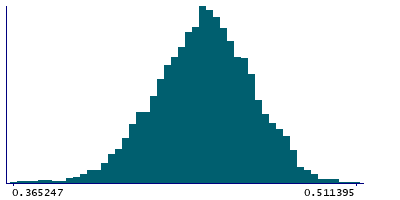
Instance 3 : First repeat imaging visit (2019+)
4,758 participants, 4,758 items
| Maximum | 0.511395 |
| Decile 9 | 0.472219 |
| Decile 8 | 0.463754 |
| Decile 7 | 0.457243 |
| Decile 6 | 0.451823 |
| Median | 0.446774 |
| Decile 4 | 0.441761 |
| Decile 3 | 0.435793 |
| Decile 2 | 0.428844 |
| Decile 1 | 0.418713 |
| Minimum | 0.345822 |
|
|
- Mean = 0.445926
- Std.dev = 0.0210968
- 8 items below graph minimum of 0.365207
|
Notes
Weighted-mean FA (fractional anisotropy) in tract left superior longitudinal fasciculus (from dMRI data)
0 Related Data-Fields
There are no related data-fields
2 Applications
| Application ID | Title |
|---|
| 17689 | Genetic, environmental and lifestyle predictors of brain/cognitive-related outcomes. |
| 22783 | The joint analysis of imaging data and genetic data for early tumor detection, prevention, diagnosis and treatment |

