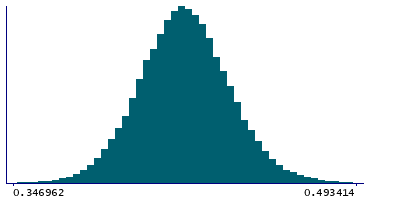
Data
83,909 items of data are available, covering 79,382 participants.
Defined-instances run from 2 to 3, labelled using Instancing
2.
Units of measurement are AU.
| Maximum | 0.522748 |
| Decile 9 | 0.445588 |
| Decile 8 | 0.43653 |
| Decile 7 | 0.430199 |
| Decile 6 | 0.425025 |
| Median | 0.420189 |
| Decile 4 | 0.415553 |
| Decile 3 | 0.410427 |
| Decile 2 | 0.404381 |
| Decile 1 | 0.396026 |
| Minimum | 0 |
|
|
- Mean = 0.420498
- Std.dev = 0.0205557
- 63 items below graph minimum of 0.346464
- 65 items above graph maximum of 0.49515
|
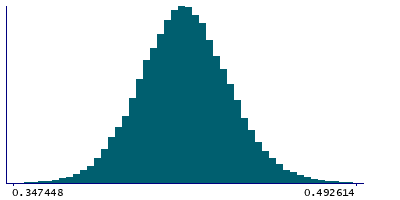
2 Instances
Instance 2 : Imaging visit (2014+)
79,151 participants, 79,151 items
| Maximum | 0.522748 |
| Decile 9 | 0.445733 |
| Decile 8 | 0.436646 |
| Decile 7 | 0.43029 |
| Decile 6 | 0.425093 |
| Median | 0.420251 |
| Decile 4 | 0.415579 |
| Decile 3 | 0.410441 |
| Decile 2 | 0.404408 |
| Decile 1 | 0.396036 |
| Minimum | 0 |
|
|
- Mean = 0.420555
- Std.dev = 0.0206498
- 60 items below graph minimum of 0.346339
- 61 items above graph maximum of 0.49543
|
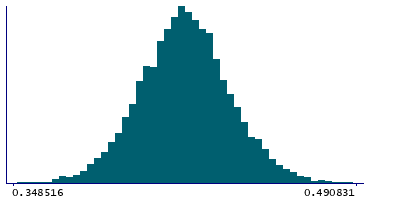
Instance 3 : First repeat imaging visit (2019+)
4,758 participants, 4,758 items
| Maximum | 0.502967 |
| Decile 9 | 0.443406 |
| Decile 8 | 0.434581 |
| Decile 7 | 0.428835 |
| Decile 6 | 0.424002 |
| Median | 0.41947 |
| Decile 4 | 0.415109 |
| Decile 3 | 0.410298 |
| Decile 2 | 0.403991 |
| Decile 1 | 0.395948 |
| Minimum | 0.34352 |
|
|
- Mean = 0.419559
- Std.dev = 0.0188976
- 3 items below graph minimum of 0.348491
- 3 items above graph maximum of 0.490863
|
Notes
Weighted-mean FA (fractional anisotropy) in tract right superior thalamic radiation (from dMRI data)
0 Related Data-Fields
There are no related data-fields
2 Applications
| Application ID | Title |
|---|
| 17689 | Genetic, environmental and lifestyle predictors of brain/cognitive-related outcomes. |
| 22783 | The joint analysis of imaging data and genetic data for early tumor detection, prevention, diagnosis and treatment |

