Data
83,909 items of data are available, covering 79,382 participants.
Defined-instances run from 2 to 3, labelled using Instancing
2.
Units of measurement are AU.
| Maximum | 0.00119528 |
| Decile 9 | 0.000849671 |
| Decile 8 | 0.000825499 |
| Decile 7 | 0.000810679 |
| Decile 6 | 0.000799356 |
| Median | 0.000789912 |
| Decile 4 | 0.000781363 |
| Decile 3 | 0.000772604 |
| Decile 2 | 0.000763169 |
| Decile 1 | 0.000751285 |
| Minimum | 0 |
|

|
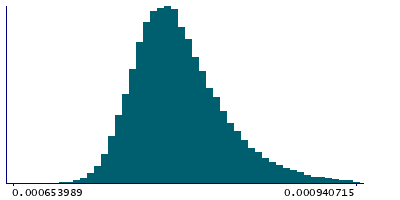
- Mean = 0.000796197
- Std.dev = 4.33113e-05
- 25 items below graph minimum of 0.000652899
- 448 items above graph maximum of 0.000948058
|
2 Instances
Instance 2 : Imaging visit (2014+)
79,151 participants, 79,151 items
| Maximum | 0.00119528 |
| Decile 9 | 0.000850346 |
| Decile 8 | 0.000826063 |
| Decile 7 | 0.000811204 |
| Decile 6 | 0.000799756 |
| Median | 0.000790255 |
| Decile 4 | 0.000781644 |
| Decile 3 | 0.000772879 |
| Decile 2 | 0.000763338 |
| Decile 1 | 0.000751385 |
| Minimum | 0 |
|
|
- Mean = 0.000796578
- Std.dev = 4.34548e-05
- 23 items below graph minimum of 0.000652425
- 415 items above graph maximum of 0.000949306
|
Instance 3 : First repeat imaging visit (2019+)
4,758 participants, 4,758 items
| Maximum | 0.0010522 |
| Decile 9 | 0.000837261 |
| Decile 8 | 0.000815543 |
| Decile 7 | 0.000802412 |
| Decile 6 | 0.000792624 |
| Median | 0.00078482 |
| Decile 4 | 0.000776636 |
| Decile 3 | 0.000768934 |
| Decile 2 | 0.000760893 |
| Decile 1 | 0.000749692 |
| Minimum | 0 |
|

|
- Mean = 0.000789858
- Std.dev = 4.03255e-05
- 2 items below graph minimum of 0.000662122
- 25 items above graph maximum of 0.000924831
|
Notes
Weighted-mean MD (mean diffusivity) in tract left anterior thalamic radiation (from dMRI data)
0 Related Data-Fields
There are no related data-fields
2 Applications
| Application ID | Title |
|---|
| 17689 | Genetic, environmental and lifestyle predictors of brain/cognitive-related outcomes. |
| 22783 | The joint analysis of imaging data and genetic data for early tumor detection, prevention, diagnosis and treatment |

