Data
83,909 items of data are available, covering 79,382 participants.
Defined-instances run from 2 to 3, labelled using Instancing
2.
Units of measurement are AU.
| Maximum | 0.00272625 |
| Decile 9 | 0.000965958 |
| Decile 8 | 0.000925516 |
| Decile 7 | 0.000903232 |
| Decile 6 | 0.000886909 |
| Median | 0.000873038 |
| Decile 4 | 0.000860178 |
| Decile 3 | 0.000847741 |
| Decile 2 | 0.000834187 |
| Decile 1 | 0.000816433 |
| Minimum | 0 |
|
|
- Mean = 0.000885407
- Std.dev = 7.19196e-05
- 21 items below graph minimum of 0.000666908
- 1131 items above graph maximum of 0.00111548
|
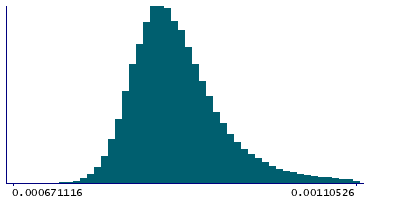
2 Instances
Instance 2 : Imaging visit (2014+)
79,151 participants, 79,151 items
| Maximum | 0.00272625 |
| Decile 9 | 0.00096725 |
| Decile 8 | 0.000926402 |
| Decile 7 | 0.000903996 |
| Decile 6 | 0.000887503 |
| Median | 0.000873619 |
| Decile 4 | 0.000860718 |
| Decile 3 | 0.00084821 |
| Decile 2 | 0.000834539 |
| Decile 1 | 0.000816758 |
| Minimum | 0 |
|

|
- Mean = 0.000886113
- Std.dev = 7.22733e-05
- 19 items below graph minimum of 0.000666266
- 1066 items above graph maximum of 0.00111774
|
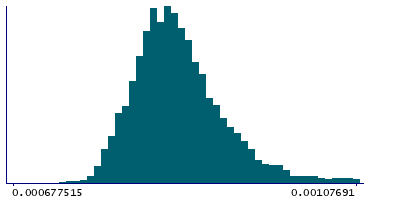
Instance 3 : First repeat imaging visit (2019+)
4,758 participants, 4,758 items
| Maximum | 0.00147174 |
| Decile 9 | 0.000943832 |
| Decile 8 | 0.000911577 |
| Decile 7 | 0.000891067 |
| Decile 6 | 0.000876296 |
| Median | 0.000864009 |
| Decile 4 | 0.000853088 |
| Decile 3 | 0.000840373 |
| Decile 2 | 0.000828273 |
| Decile 1 | 0.00081065 |
| Minimum | 0 |
|
|
- Mean = 0.000873669
- Std.dev = 6.46363e-05
- 2 items below graph minimum of 0.000677468
- 62 items above graph maximum of 0.00107701
|
Notes
Weighted-mean MD (mean diffusivity) in tract left parahippocampal part of cingulum (from dMRI data)
0 Related Data-Fields
There are no related data-fields
2 Applications
| Application ID | Title |
|---|
| 17689 | Genetic, environmental and lifestyle predictors of brain/cognitive-related outcomes. |
| 22783 | The joint analysis of imaging data and genetic data for early tumor detection, prevention, diagnosis and treatment |

