Data
83,909 items of data are available, covering 79,382 participants.
Defined-instances run from 2 to 3, labelled using Instancing
2.
Units of measurement are AU.
| Maximum | 0.00202427 |
| Decile 9 | 0.000992448 |
| Decile 8 | 0.000950177 |
| Decile 7 | 0.000926125 |
| Decile 6 | 0.00090794 |
| Median | 0.000893005 |
| Decile 4 | 0.000879212 |
| Decile 3 | 0.000866233 |
| Decile 2 | 0.000851759 |
| Decile 1 | 0.000832563 |
| Minimum | 0 |
|
|
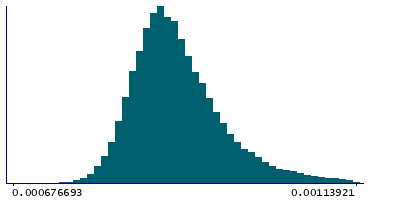
- Mean = 0.000905361
- Std.dev = 7.30377e-05
- 23 items below graph minimum of 0.000672678
- 794 items above graph maximum of 0.00115233
|
2 Instances
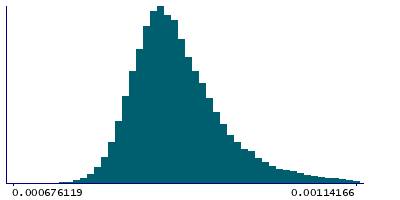
Instance 2 : Imaging visit (2014+)
79,151 participants, 79,151 items
| Maximum | 0.00202427 |
| Decile 9 | 0.000993468 |
| Decile 8 | 0.000951188 |
| Decile 7 | 0.000926949 |
| Decile 6 | 0.000908625 |
| Median | 0.000893575 |
| Decile 4 | 0.000879811 |
| Decile 3 | 0.000866697 |
| Decile 2 | 0.000852224 |
| Decile 1 | 0.000832977 |
| Minimum | 0 |
|
|
- Mean = 0.000906147
- Std.dev = 7.3289e-05
- 20 items below graph minimum of 0.000672485
- 757 items above graph maximum of 0.00115396
|
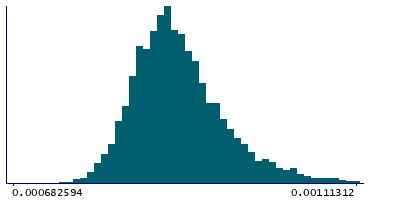
Instance 3 : First repeat imaging visit (2019+)
4,758 participants, 4,758 items
| Maximum | 0.00154399 |
| Decile 9 | 0.000969712 |
| Decile 8 | 0.000935269 |
| Decile 7 | 0.000912787 |
| Decile 6 | 0.000896524 |
| Median | 0.000882918 |
| Decile 4 | 0.000871076 |
| Decile 3 | 0.000858515 |
| Decile 2 | 0.000843479 |
| Decile 1 | 0.000826118 |
| Minimum | 0 |
|
|
- Mean = 0.000892285
- Std.dev = 6.7391e-05
- 3 items below graph minimum of 0.000682524
- 38 items above graph maximum of 0.00111331
|
Notes
Weighted-mean MD (mean diffusivity) in tract right parahippocampal part of cingulum (from dMRI data)
0 Related Data-Fields
There are no related data-fields
2 Applications
| Application ID | Title |
|---|
| 17689 | Genetic, environmental and lifestyle predictors of brain/cognitive-related outcomes. |
| 22783 | The joint analysis of imaging data and genetic data for early tumor detection, prevention, diagnosis and treatment |

