Data
83,909 items of data are available, covering 79,382 participants.
Defined-instances run from 2 to 3, labelled using Instancing
2.
Units of measurement are AU.
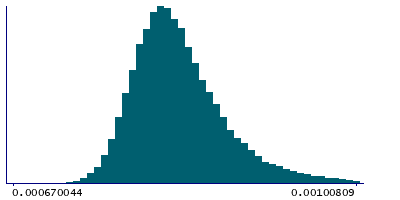
| Maximum | 0.00144379 |
| Decile 9 | 0.000898086 |
| Decile 8 | 0.000868587 |
| Decile 7 | 0.00085087 |
| Decile 6 | 0.000837818 |
| Median | 0.00082692 |
| Decile 4 | 0.000816985 |
| Decile 3 | 0.000807189 |
| Decile 2 | 0.000796324 |
| Decile 1 | 0.000782478 |
| Minimum | 0 |
|
|
- Mean = 0.000835438
- Std.dev = 5.23603e-05
- 21 items below graph minimum of 0.00066687
- 701 items above graph maximum of 0.00101369
|
2 Instances
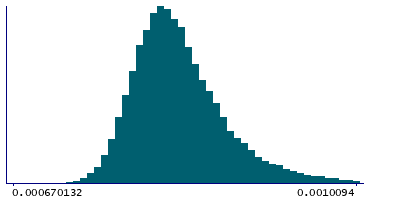
Instance 2 : Imaging visit (2014+)
79,151 participants, 79,151 items
| Maximum | 0.00144379 |
| Decile 9 | 0.000898929 |
| Decile 8 | 0.000869362 |
| Decile 7 | 0.000851693 |
| Decile 6 | 0.000838432 |
| Median | 0.000827605 |
| Decile 4 | 0.000817575 |
| Decile 3 | 0.00080774 |
| Decile 2 | 0.000796801 |
| Decile 1 | 0.000782855 |
| Minimum | 0 |
|
|
- Mean = 0.000836084
- Std.dev = 5.24921e-05
- 19 items below graph minimum of 0.000666781
- 654 items above graph maximum of 0.001015
|
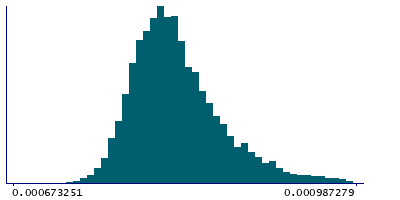
Instance 3 : First repeat imaging visit (2019+)
4,758 participants, 4,758 items
| Maximum | 0.00119184 |
| Decile 9 | 0.000882769 |
| Decile 8 | 0.000854469 |
| Decile 7 | 0.000838324 |
| Decile 6 | 0.000826076 |
| Median | 0.000816971 |
| Decile 4 | 0.000808319 |
| Decile 3 | 0.000799291 |
| Decile 2 | 0.000789615 |
| Decile 1 | 0.000777905 |
| Minimum | 0 |
|
|
- Mean = 0.000824703
- Std.dev = 4.88826e-05
- 2 items below graph minimum of 0.000673041
- 46 items above graph maximum of 0.000987632
|
Notes
Weighted-mean MD (mean diffusivity) in tract left posterior thalamic radiation (from dMRI data)
0 Related Data-Fields
There are no related data-fields
2 Applications
| Application ID | Title |
|---|
| 17689 | Genetic, environmental and lifestyle predictors of brain/cognitive-related outcomes. |
| 22783 | The joint analysis of imaging data and genetic data for early tumor detection, prevention, diagnosis and treatment |

