Data
83,909 items of data are available, covering 79,382 participants.
Defined-instances run from 2 to 3, labelled using Instancing
2.
Units of measurement are AU.
| Maximum | 0.00170008 |
| Decile 9 | 0.000802096 |
| Decile 8 | 0.000785973 |
| Decile 7 | 0.000775647 |
| Decile 6 | 0.00076774 |
| Median | 0.000760674 |
| Decile 4 | 0.000753995 |
| Decile 3 | 0.000747181 |
| Decile 2 | 0.000739563 |
| Decile 1 | 0.000729034 |
| Minimum | 0 |
|
|
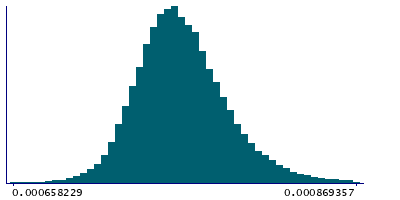
- Mean = 0.000763726
- Std.dev = 3.3063e-05
- 75 items below graph minimum of 0.000655972
- 459 items above graph maximum of 0.000875158
|
2 Instances
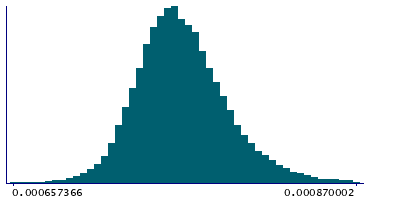
Instance 2 : Imaging visit (2014+)
79,151 participants, 79,151 items
| Maximum | 0.00170008 |
| Decile 9 | 0.00080237 |
| Decile 8 | 0.000786148 |
| Decile 7 | 0.00077579 |
| Decile 6 | 0.00076784 |
| Median | 0.000760702 |
| Decile 4 | 0.000753987 |
| Decile 3 | 0.000747125 |
| Decile 2 | 0.00073947 |
| Decile 1 | 0.00072887 |
| Minimum | 0 |
|
|
- Mean = 0.000763755
- Std.dev = 3.32815e-05
- 72 items below graph minimum of 0.00065537
- 432 items above graph maximum of 0.00087587
|
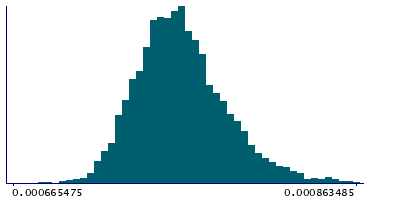
Instance 3 : First repeat imaging visit (2019+)
4,758 participants, 4,758 items
| Maximum | 0.00128334 |
| Decile 9 | 0.00079749 |
| Decile 8 | 0.000783144 |
| Decile 7 | 0.000773422 |
| Decile 6 | 0.000766327 |
| Median | 0.000760365 |
| Decile 4 | 0.000754199 |
| Decile 3 | 0.000747781 |
| Decile 2 | 0.000741188 |
| Decile 1 | 0.00073147 |
| Minimum | 0.000648541 |
|
|
- Mean = 0.00076324
- Std.dev = 2.91848e-05
- 1 item below graph minimum of 0.00066545
- 27 items above graph maximum of 0.000863511
|
Notes
Weighted-mean MD (mean diffusivity) in tract right superior thalamic radiation (from dMRI data)
0 Related Data-Fields
There are no related data-fields
2 Applications
| Application ID | Title |
|---|
| 17689 | Genetic, environmental and lifestyle predictors of brain/cognitive-related outcomes. |
| 22783 | The joint analysis of imaging data and genetic data for early tumor detection, prevention, diagnosis and treatment |

