Data
83,909 items of data are available, covering 79,382 participants.
Defined-instances run from 2 to 3, labelled using Instancing
2.
Units of measurement are AU.
| Maximum | 0.00206102 |
| Decile 9 | 0.000854913 |
| Decile 8 | 0.000835637 |
| Decile 7 | 0.000822545 |
| Decile 6 | 0.0008121 |
| Median | 0.000802754 |
| Decile 4 | 0.000793843 |
| Decile 3 | 0.000784746 |
| Decile 2 | 0.000774337 |
| Decile 1 | 0.00076088 |
| Minimum | 0 |
|

|
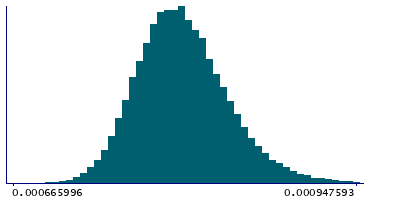
- Mean = 0.000806136
- Std.dev = 4.08974e-05
- 11 items below graph minimum of 0.000666847
- 246 items above graph maximum of 0.000948947
|
2 Instances
Instance 2 : Imaging visit (2014+)
79,151 participants, 79,151 items
| Maximum | 0.00206102 |
| Decile 9 | 0.000855457 |
| Decile 8 | 0.000836122 |
| Decile 7 | 0.000823094 |
| Decile 6 | 0.000812644 |
| Median | 0.000803198 |
| Decile 4 | 0.000794283 |
| Decile 3 | 0.000785099 |
| Decile 2 | 0.000774649 |
| Decile 1 | 0.000761083 |
| Minimum | 0 |
|
|
- Mean = 0.000806563
- Std.dev = 4.10267e-05
- 10 items below graph minimum of 0.000666709
- 237 items above graph maximum of 0.000949831
|
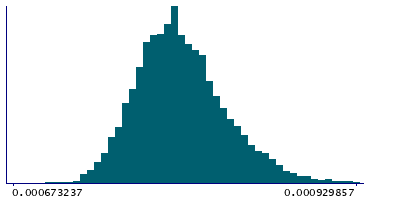
Instance 3 : First repeat imaging visit (2019+)
4,758 participants, 4,758 items
| Maximum | 0.00155324 |
| Decile 9 | 0.000844319 |
| Decile 8 | 0.000825021 |
| Decile 7 | 0.000813479 |
| Decile 6 | 0.000803737 |
| Median | 0.000795385 |
| Decile 4 | 0.000788164 |
| Decile 3 | 0.000779604 |
| Decile 2 | 0.000770791 |
| Decile 1 | 0.000758779 |
| Minimum | 0 |
|
|
- Mean = 0.000799036
- Std.dev = 3.79857e-05
- 1 item below graph minimum of 0.000673238
- 11 items above graph maximum of 0.000929859
|
Notes
Weighted-mean MD (mean diffusivity) in tract left uncinate fasciculus (from dMRI data)
0 Related Data-Fields
There are no related data-fields
2 Applications
| Application ID | Title |
|---|
| 17689 | Genetic, environmental and lifestyle predictors of brain/cognitive-related outcomes. |
| 22783 | The joint analysis of imaging data and genetic data for early tumor detection, prevention, diagnosis and treatment |

