Data
83,909 items of data are available, covering 79,382 participants.
Defined-instances run from 2 to 3, labelled using Instancing
2.
Units of measurement are AU.
| Maximum | 0.65278 |
| Decile 9 | 0.425179 |
| Decile 8 | 0.396901 |
| Decile 7 | 0.37691 |
| Decile 6 | 0.359826 |
| Median | 0.343851 |
| Decile 4 | 0.328126 |
| Decile 3 | 0.311311 |
| Decile 2 | 0.291649 |
| Decile 1 | 0.263373 |
| Minimum | -0.0158802 |
|

|
- Mean = 0.344053
- Std.dev = 0.0641157
- 1 item below graph minimum of 0
- 12 items above graph maximum of 0.586986
|
2 Instances
Instance 2 : Imaging visit (2014+)
79,151 participants, 79,151 items
| Maximum | 0.65278 |
| Decile 9 | 0.425467 |
| Decile 8 | 0.397112 |
| Decile 7 | 0.377205 |
| Decile 6 | 0.359954 |
| Median | 0.34403 |
| Decile 4 | 0.328258 |
| Decile 3 | 0.31138 |
| Decile 2 | 0.291812 |
| Decile 1 | 0.263492 |
| Minimum | -0.0158802 |
|
|
- Mean = 0.344249
- Std.dev = 0.0641771
- 1 item below graph minimum of 0
- 12 items above graph maximum of 0.587442
|
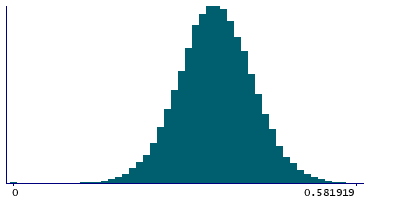
Instance 3 : First repeat imaging visit (2019+)
4,758 participants, 4,758 items
| Maximum | 0.586199 |
| Decile 9 | 0.420746 |
| Decile 8 | 0.392249 |
| Decile 7 | 0.373189 |
| Decile 6 | 0.357789 |
| Median | 0.34081 |
| Decile 4 | 0.326047 |
| Decile 3 | 0.310136 |
| Decile 2 | 0.289229 |
| Decile 1 | 0.260774 |
| Minimum | 0 |
|

|
- Mean = 0.340801
- Std.dev = 0.0629973
- 1 item above graph maximum of 0.580719
|
Notes
Weighted-mean MO (diffusion tensor mode) in tract right acoustic radiation (from dMRI data)
0 Related Data-Fields
There are no related data-fields
2 Applications
| Application ID | Title |
|---|
| 17689 | Genetic, environmental and lifestyle predictors of brain/cognitive-related outcomes. |
| 22783 | The joint analysis of imaging data and genetic data for early tumor detection, prevention, diagnosis and treatment |

