Data
83,909 items of data are available, covering 79,382 participants.
Defined-instances run from 2 to 3, labelled using Instancing
2.
Units of measurement are AU.
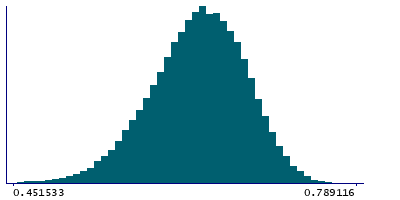
| Maximum | 0.790563 |
| Decile 9 | 0.6899 |
| Decile 8 | 0.672201 |
| Decile 7 | 0.658793 |
| Decile 6 | 0.64696 |
| Median | 0.635346 |
| Decile 4 | 0.623453 |
| Decile 3 | 0.610198 |
| Decile 2 | 0.593999 |
| Decile 1 | 0.570917 |
| Minimum | 0 |
|
|
- Mean = 0.632187
- Std.dev = 0.0480073
- 82 items below graph minimum of 0.451934
|
2 Instances
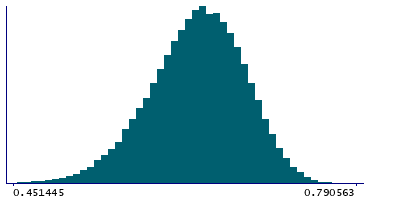
Instance 2 : Imaging visit (2014+)
79,151 participants, 79,151 items
| Maximum | 0.790563 |
| Decile 9 | 0.689965 |
| Decile 8 | 0.672276 |
| Decile 7 | 0.658809 |
| Decile 6 | 0.646972 |
| Median | 0.635383 |
| Decile 4 | 0.623505 |
| Decile 3 | 0.610237 |
| Decile 2 | 0.594015 |
| Decile 1 | 0.570901 |
| Minimum | 0 |
|
|
- Mean = 0.632236
- Std.dev = 0.0479447
- 76 items below graph minimum of 0.451836
|
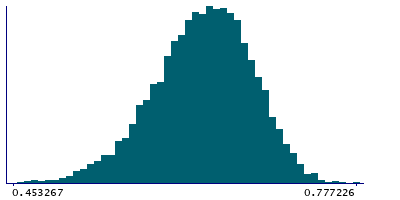
Instance 3 : First repeat imaging visit (2019+)
4,758 participants, 4,758 items
| Maximum | 0.777226 |
| Decile 9 | 0.688944 |
| Decile 8 | 0.671196 |
| Decile 7 | 0.658372 |
| Decile 6 | 0.64667 |
| Median | 0.634741 |
| Decile 4 | 0.622544 |
| Decile 3 | 0.609396 |
| Decile 2 | 0.593823 |
| Decile 1 | 0.571096 |
| Minimum | 0 |
|
|
- Mean = 0.631368
- Std.dev = 0.0490302
- 5 items below graph minimum of 0.453247
|
Notes
Weighted-mean MO (diffusion tensor mode) in tract right corticospinal tract (from dMRI data)
0 Related Data-Fields
There are no related data-fields
2 Applications
| Application ID | Title |
|---|
| 17689 | Genetic, environmental and lifestyle predictors of brain/cognitive-related outcomes. |
| 22783 | The joint analysis of imaging data and genetic data for early tumor detection, prevention, diagnosis and treatment |

