Data
83,909 items of data are available, covering 79,382 participants.
Defined-instances run from 2 to 3, labelled using Instancing
2.
Units of measurement are AU.
| Maximum | 0.628649 |
| Decile 9 | 0.521997 |
| Decile 8 | 0.507981 |
| Decile 7 | 0.497708 |
| Decile 6 | 0.488728 |
| Median | 0.480228 |
| Decile 4 | 0.471692 |
| Decile 3 | 0.462328 |
| Decile 2 | 0.451582 |
| Decile 1 | 0.436178 |
| Minimum | 0 |
|

|
- Mean = 0.479353
- Std.dev = 0.0343357
- 70 items below graph minimum of 0.350358
- 1 item above graph maximum of 0.607817
|
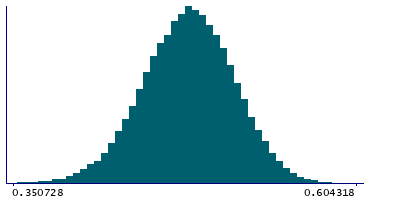
2 Instances
Instance 2 : Imaging visit (2014+)
79,151 participants, 79,151 items
| Maximum | 0.628649 |
| Decile 9 | 0.521915 |
| Decile 8 | 0.507827 |
| Decile 7 | 0.497516 |
| Decile 6 | 0.488522 |
| Median | 0.480048 |
| Decile 4 | 0.471497 |
| Decile 3 | 0.46208 |
| Decile 2 | 0.451302 |
| Decile 1 | 0.435848 |
| Minimum | 0 |
|
|
- Mean = 0.47916
- Std.dev = 0.0344002
- 67 items below graph minimum of 0.34978
- 1 item above graph maximum of 0.607983
|
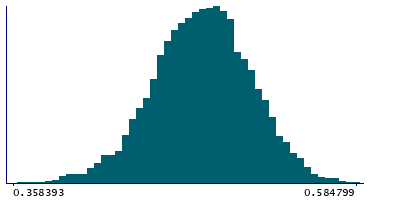
Instance 3 : First repeat imaging visit (2019+)
4,758 participants, 4,758 items
| Maximum | 0.584799 |
| Decile 9 | 0.523765 |
| Decile 8 | 0.510238 |
| Decile 7 | 0.500046 |
| Decile 6 | 0.491658 |
| Median | 0.483557 |
| Decile 4 | 0.475123 |
| Decile 3 | 0.466087 |
| Decile 2 | 0.456212 |
| Decile 1 | 0.441075 |
| Minimum | 0 |
|
|
- Mean = 0.48256
- Std.dev = 0.0330801
- 3 items below graph minimum of 0.358385
|
Notes
Weighted-mean MO (diffusion tensor mode) in tract right inferior longitudinal fasciculus (from dMRI data)
0 Related Data-Fields
There are no related data-fields
2 Applications
| Application ID | Title |
|---|
| 17689 | Genetic, environmental and lifestyle predictors of brain/cognitive-related outcomes. |
| 22783 | The joint analysis of imaging data and genetic data for early tumor detection, prevention, diagnosis and treatment |

