Data
83,909 items of data are available, covering 79,382 participants.
Defined-instances run from 2 to 3, labelled using Instancing
2.
Units of measurement are AU.
| Maximum | 0.829711 |
| Decile 9 | 0.725949 |
| Decile 8 | 0.70938 |
| Decile 7 | 0.696974 |
| Decile 6 | 0.685861 |
| Median | 0.675412 |
| Decile 4 | 0.664373 |
| Decile 3 | 0.652387 |
| Decile 2 | 0.63791 |
| Decile 1 | 0.616555 |
| Minimum | 0 |
|
|
- Mean = 0.672618
- Std.dev = 0.044581
- 151 items below graph minimum of 0.507161
|
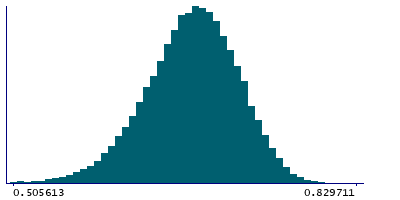
2 Instances
Instance 2 : Imaging visit (2014+)
79,151 participants, 79,151 items
| Maximum | 0.829711 |
| Decile 9 | 0.725533 |
| Decile 8 | 0.709028 |
| Decile 7 | 0.696596 |
| Decile 6 | 0.685475 |
| Median | 0.675007 |
| Decile 4 | 0.663983 |
| Decile 3 | 0.651989 |
| Decile 2 | 0.637524 |
| Decile 1 | 0.616321 |
| Minimum | 0 |
|

|
- Mean = 0.672247
- Std.dev = 0.0445232
- 143 items below graph minimum of 0.507109
|
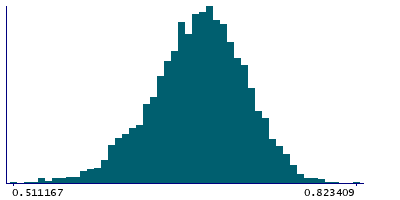
Instance 3 : First repeat imaging visit (2019+)
4,758 participants, 4,758 items
| Maximum | 0.823409 |
| Decile 9 | 0.731942 |
| Decile 8 | 0.715354 |
| Decile 7 | 0.702734 |
| Decile 6 | 0.691758 |
| Median | 0.6817 |
| Decile 4 | 0.670907 |
| Decile 3 | 0.659557 |
| Decile 2 | 0.644758 |
| Decile 1 | 0.621507 |
| Minimum | 0 |
|
|
- Mean = 0.678777
- Std.dev = 0.045088
- 10 items below graph minimum of 0.511073
|
Notes
Weighted-mean MO (diffusion tensor mode) in tract right medial lemniscus (from dMRI data)
0 Related Data-Fields
There are no related data-fields
2 Applications
| Application ID | Title |
|---|
| 17689 | Genetic, environmental and lifestyle predictors of brain/cognitive-related outcomes. |
| 22783 | The joint analysis of imaging data and genetic data for early tumor detection, prevention, diagnosis and treatment |

