Data
83,909 items of data are available, covering 79,382 participants.
Defined-instances run from 2 to 3, labelled using Instancing
2.
Units of measurement are AU.
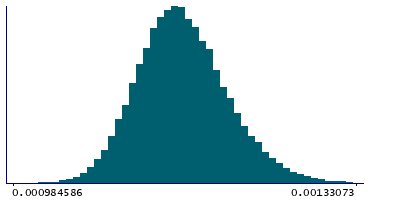
| Maximum | 0.00187792 |
| Decile 9 | 0.00121154 |
| Decile 8 | 0.00118836 |
| Decile 7 | 0.00117296 |
| Decile 6 | 0.00116013 |
| Median | 0.00114876 |
| Decile 4 | 0.00113749 |
| Decile 3 | 0.00112611 |
| Decile 2 | 0.00111284 |
| Decile 1 | 0.00109517 |
| Minimum | 0 |
|
|
- Mean = 0.00115128
- Std.dev = 5.1114e-05
- 33 items below graph minimum of 0.000978794
- 112 items above graph maximum of 0.00132792
|
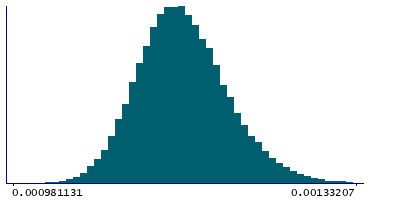
2 Instances
Instance 2 : Imaging visit (2014+)
79,151 participants, 79,151 items
| Maximum | 0.00187792 |
| Decile 9 | 0.00121196 |
| Decile 8 | 0.00118872 |
| Decile 7 | 0.00117331 |
| Decile 6 | 0.00116042 |
| Median | 0.00114903 |
| Decile 4 | 0.00113768 |
| Decile 3 | 0.00112627 |
| Decile 2 | 0.00111302 |
| Decile 1 | 0.00109531 |
| Minimum | 0 |
|
|
- Mean = 0.00115157
- Std.dev = 5.10211e-05
- 29 items below graph minimum of 0.000978654
- 109 items above graph maximum of 0.00132861
|
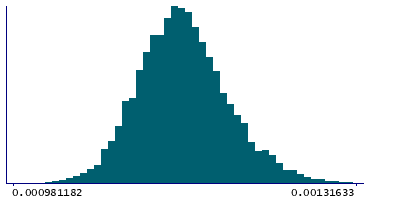
Instance 3 : First repeat imaging visit (2019+)
4,758 participants, 4,758 items
| Maximum | 0.0013331 |
| Decile 9 | 0.00120466 |
| Decile 8 | 0.00118183 |
| Decile 7 | 0.00116739 |
| Decile 6 | 0.0011552 |
| Median | 0.00114478 |
| Decile 4 | 0.00113481 |
| Decile 3 | 0.00112325 |
| Decile 2 | 0.00111056 |
| Decile 1 | 0.00109291 |
| Minimum | 0 |
|
|
- Mean = 0.00114648
- Std.dev = 5.2403e-05
- 4 items below graph minimum of 0.000981167
- 4 items above graph maximum of 0.00131641
|
Notes
Weighted-mean L1 in tract left acoustic radiation (from dMRI data)
0 Related Data-Fields
There are no related data-fields
2 Applications
| Application ID | Title |
|---|
| 17689 | Genetic, environmental and lifestyle predictors of brain/cognitive-related outcomes. |
| 22783 | The joint analysis of imaging data and genetic data for early tumor detection, prevention, diagnosis and treatment |

